


In trading, information is key. Understanding where most traders are active can reveal insights into market behavior. While indicators like moving averages and RSI display trends, they don’t pinpoint significant price action.
The Profile Indicator addresses this by visualizing trading activity across price levels, with a focus on volume and participation. This helps identify where buyers and sellers are most active, enhancing your grasp of market structure and key price areas.
What Is a Profile Indicator?
The Profile Indicator is a tool for analyzing the market. It shows how trading activity is distributed across different price levels. Unlike candles or bars that display price changes over time, it reveals the amount of trading at each price.
Visually, it resembles a horizontal histogram alongside your price chart. Each bar shows the volume of trades at that specific price. The longest bars indicate the price levels where most trading happened, known as “high activity zones.”
In short, the Profile Indicator highlights where the market focused its trading energy.
What Is A Volume Profile?
The volume profile is a charting tool that displays trading activity over a specific time period at various price levels. It considers user-defined settings, like the number of rows and the time frame, and creates a histogram on the chart. This histogram helps traders see key price levels based on trading volume.
The volume profile breaks down the total trading volume at a particular price during that time. It separates this into two categories: up volume (trades that increased the price) and down volume (trades that decreased the price). This way, traders can easily see how much volume occurred at different price levels.
How It Works In Trading
To understand how this indicator works, think of the market as a negotiation between buyers and sellers. When both sides agree on a price, trading volume increases, resulting in thick areas on the profile. When they disagree, the price moves quickly, creating thin regions.
These thick and thin zones show a visual map of market balance and imbalance. Balanced areas indicate where the market found fair value and accepted the price. Imbalanced areas indicate where one side has taken control, suggesting potential breakout zones.
This concept enables traders to identify support and resistance levels, entry and exit points, and potential reversals.
Calculation Methodology
Volume profile indicators aggregate data from smaller timeframes, like 1-minute bars, to create a volume profile for a daily session. They analyze price levels where trades occurred and classify bars as up or down based on whether they close above or below their opening price. This information is then added to the volume profile histogram, with the choice of a smaller timeframe varying by indicator.
Understanding The Volume Profile Indicator
The Volume Profile Indicator is the most popular type of Profile Indicator. It illustrates the trading volume at each price level during a specified time period.
How It Looks:
When you turn on the Volume Profile on your chart, you will see horizontal bars that create a side histogram.
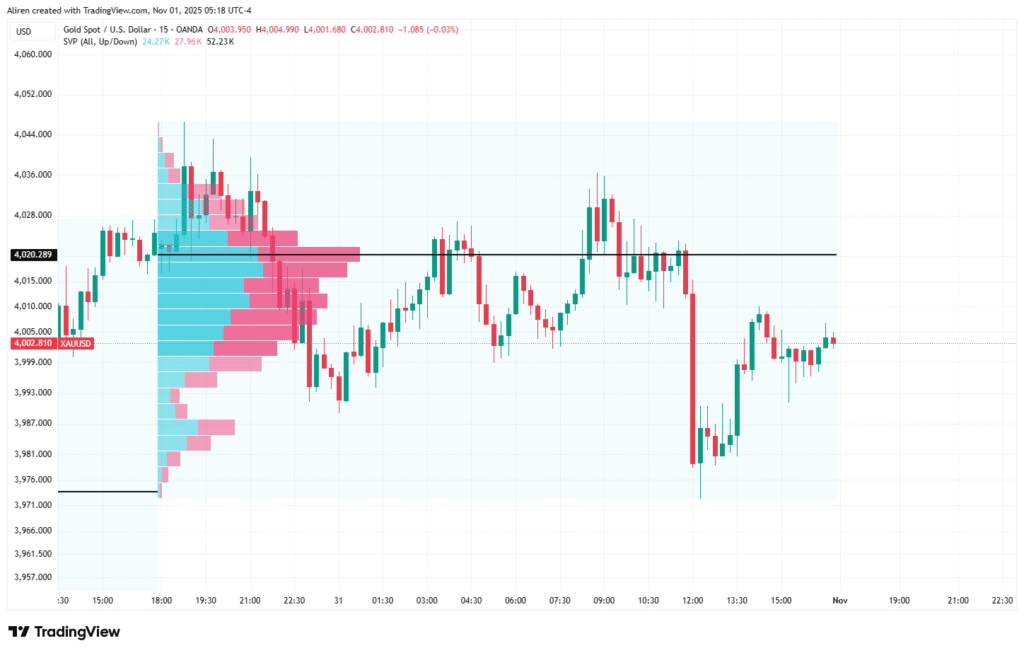
– Longer bars mean more trading volume (this indicates high interest).
– Shorter bars mean less activity (price moved quickly through these levels).
The Volume Profile helps traders understand the true nature of price movement. It reveals not only how far the price has risen, but also where actual trading took place.
Key Elements Of The Volume Profile
There are three essential components every trader should understand:
1. Point Of Control (POC)
The POC is the price level with the highest traded volume.
It’s where the majority of market participants agreed on price, often acting as a strong magnet for price action.
Traders use POC to identify:
- Fair value zones
- High probability reversal areas
- Key decision points for entries and exits
2. High Volume Nodes (HVNs)
These areas on the profile are referred to as “thick” areas. They indicate price levels where a lot of trading activity occurred, which means they act as strong support or resistance. Markets often slow down or change Direction near High Volume Nodes (HVNs) because both buyers and sellers see value there.
3. Low Volume Nodes (LVNs)
LVNs are areas with little trading activity. They often serve as breakout zones where prices quickly move between high-volume areas.
How To Use The Profile Indicator In Your Trading Strategy
The Profile Indicator can be used in multiple ways depending on your style of trading — whether you’re a day trader, swing trader, or long-term investor.
Here are the most common and practical applications:
1. Identify Strong Support And Resistance
High-volume areas on the profile indicate spots where prices may stop or change direction. When prices return to these areas, traders look for reactions, making them helpful in planning entries, setting stop-losses, or determining targets.
2. Detect Breakout And Imbalance Zones
Low-volume areas usually indicate previous fast price movements.
When price reenters this zone, it tends to move quickly through it — ideal for breakout traders looking to capitalize on momentum.
3. Combine With Trend Analysis
While the Profile Indicator shows where activity occurred, it doesn’t show the Direction of that activity.
Combining it with trend indicators (like moving averages or trendlines) provides a more complete picture.
4. Spot Fair Value Areas
The market often oscillates between value and imbalance.
When the price returns to a previously balanced area (HVN or POC), it often stabilizes or reverses, offering high-probability setups.
Calculating The Value Area
To find the total traded volume, add the total buys and sells together, then multiply that by 0.7 for 70% (or any percentage the trader prefers).
Start with the point of control (POC), the row with the highest total volume, and note this volume. This will be the first part of the value area.
Next, add the volumes of the two rows above and the two rows below the POC. Compare these two totals, take the larger one, and add it to the POC volume. Repeat this process, checking the two rows above and below the POC, until the total volume for the value area equals or is slightly more than the number from earlier.
The highest point in your value area will be the value area high (VAH), and the lowest point will be the value area low (VAL).
Example Strategy Of Trading Using Profile Indicator
Volume profile is a valuable trading tool with various applications. One strategy compares the current day’s opening price to the previous day’s volume profile.
If the current day opens above the previous day’s value area (but below the profile high), expect a pullback toward the point of control before the price rises, creating a buying opportunity.
If it opens below the value area (but above the profile low), look for a pullback toward the point of control before the price falls, signaling a selling opportunity.
If the opening price is outside the previous day’s profile (above the high or below the low), it may indicate a strong movement in the direction of the opening price.
Advantages Of Using The Profile Indicator
- Deeper Market Insight — It reveals where the real trading happened, not just how far the price moved.
- Better Risk Management — You can place stop-losses and take-profits more intelligently around key volume zones
- Improved Entry Timing — Helps find low-risk entries when price returns to high-volume support or resistance.
- Works Across Markets — Useful for forex, crypto, stocks, and futures alike.
- Adaptable — Can be applied to different timeframes — intraday, swing, or position trading.
Limitations and Common Mistakes
The Profile Indicator has its limitations.
It shows where trading happened, but not if buyers or sellers were in control.
Volume data can be misleading without a thorough understanding of market structure. Always combine it with trend analysis or price action.
Understanding HVNs, LVNs, and POC zones can be difficult at first. It takes time and practice to get accustomed to it.
The shape of the profile can change based on the session or timeframe you select, so it’s essential to be consistent.
Practical Tips for Traders
Here are some helpful tips for using the Profile Indicator effectively:
1. Use Multiple Timeframes: Look at daily and intraday charts to confirm strong price levels.
2. Watch for Rejections at LVNs: Prices often bounce quickly from low-volume areas, which is suitable for short-term trades.
3. Align with the Trend: In an uptrend, find support zones using the profile (buy from High-Volume Nodes below). In a downtrend, find resistance zones (sell from High-Volume Nodes above).
4. Mark the POC: Keep the Point of Control on your chart, as prices often return to this level.
5. Combine with Order Flow Tools: If you’re an advanced trader, using Volume Profile with order flow or delta volume can provide more insight.
6. Journal every trade: It doesn’t matter which indicator you are using or what kind of trader you are. Using a trading journal, such as UltraTrader, is a must.

Start Journaling Today

Start Journaling Today
Conclusion
The Profile Indicator displays the current market price and helps identify support and resistance zones through analysis of trading volume. This tool is beneficial for understanding market balance across forex, crypto, and stocks, enhancing decision-making. It reveals past market interest rather than predicting the future, enabling you to understand the market’s narrative.