

Many traders lose money not because their strategy is bad, but because their review process is weak or missing. For example, a trader with a 60% win rate may still lose due to irregular reviews. They record trades but do not analyze patterns or adjust rules based on past performance. Without insights from losing trades, they repeat mistakes and miss potential profits.
A trading journal does not improve your performance. Recording trades is the first step. The real edge appears when you review those trades in a structured way, extract patterns, and turn those patterns into new rules.
In professional trading communities, traders who review their journals regularly often see clear improvements in win rate and less emotional trading. They build a repeatable edge instead of relying on luck. Most traders lack a clear framework for these reviews.
Quick Self-Diagnosis: Are any of these true for you?
- Do you often record trades but rarely take time to analyze them? (Yes/No)
- When reviewing, do you tend to focus more on your successful trades? (Yes/No)
- Are your journal reviews sporadic and typically prompted by losses? (Yes/No)
- Do you capture insights but struggle to turn them into actionable rules? (Yes/No)
If your answer to any question is Yes, this guide provides a practical 7-step framework to review your trading journal. It works for forex, stocks, options, futures, and crypto. The goal is to move from random review to a consistent, professional process. Tools such as UltraTrader, spreadsheets, or other trading journal apps can support this, but the core logic is tool-agnostic.
The 7-Step Trading Journal Review Framework
Step 1: The Daily Micro-Review (5 Minutes Every Day)
The daily micro-review is a quick check at the end of your trading session. Its purpose is to capture details while they are still fresh.
Do this right after you finish trading. It should take no more than five minutes.
What to record:
- Entry price, exit price, position size, P&L, trade duration
- The setup or reason for the trade (for example: breakout, retest, news, range trade)
- A short explanation of why you took the trade
- Your emotional state when trading (confident, hesitant, fearful, greedy, bored)
- Whether the trade followed your trading plan or not
This is easier with a journal tool that automatically imports trades. For example, UltraTrader pulls trade data and metrics from supported brokers, so you only add reasoning and emotional notes. This reduces friction and increases the likelihood that you will log every trade.
The goal of the daily micro-review is not deep analysis. It is to build complete, accurate data for later analysis.
Step 2: Weekly Pattern Scan (30–45 Minutes)
Once a week, shift from individual trades to the bigger picture. The weekly review is where you start to see patterns.
In this session, you:
- Look at all the trades from the week together
- Group trades by setup, asset, time of day, and direction (long/short)
- Calculate basic statistics for the week: total P&L, weekly win rate, largest win, largest loss
- Mark trades with clear rule violations or strong emotional influence
- Identify your best day and your worst day of the week
Key dimensions to check:
Time-based patterns
- Which session works better for you (e.g., London open, New York open, late session)?
- Are certain days of the week consistently worse (for example, Fridays)?
- Do you start overtrading when volatility drops?
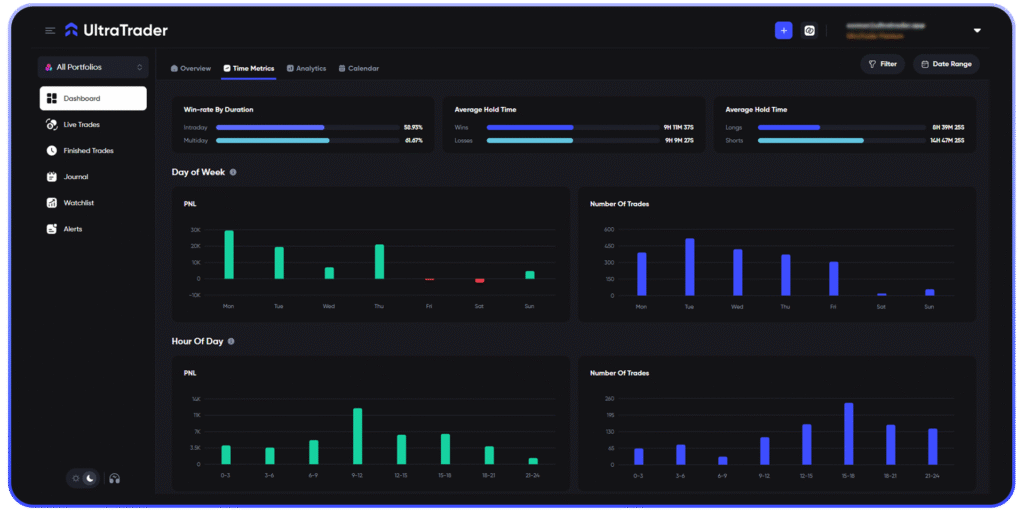
With a dashboard, this is much faster. UltraTrader’s Time Metrics tab, for example, shows your PNL by hour, day, and trade duration. You can quickly see which time windows are profitable and which hours are a liability.
Setup-based patterns
- Which setups have the highest win rate and best expectancy?
- Which setups are close to break-even or clearly negative?
- Are you trading your strongest setups often enough?
Emotional patterns
- After a loss, do you change your behavior (for example, revenge trading)?
- Did you break your rules on specific days?
- Are losses connected with boredom, FOMO, or fear?
Market condition patterns
- Does your strategy perform better in trending or ranging markets?
- Which symbols or instruments are giving you stable performance?
- Are there markets that constantly generate noise and losses for you?
At the end of the weekly review, write a short summary with 3–5 bullet points. For example:
- Breakout setups worked well early in the week; later in the week, performance dropped
- Overtrading appeared on Friday afternoon during low volatility
- Best performance came from EURUSD; worst from gold scalps
- Emotional pressure increased after two consecutive losses
This summary feeds into the monthly review.
Step 3: Emotional Context Analysis
Most traders accept that emotions matter, but do not systematically measure their impact.
The emotional context of each trade is important data. It shows how your state of mind affects execution.
In this step:
- Review the emotional tags you added during the week
- Group trades by emotional state (confident, fearful, greedy, bored, rushed)
- Compare performance for each emotional state
- Identify external factors (lack of sleep, personal stress, distractions)
Key questions:
- Do confident trades have a higher win rate or better RR than uncertain trades?
- Are you exiting trades too early when you feel fear?
- Do you increase position size impulsively after a big win or loss?
If your journal tool provides a Finished Trades PNL chart like UltraTrader does, use the shape of the curve as feedback. A smooth, consistent equity curve typically reflects controlled risk and stable emotions. A sharp, volatile curve with big spikes and deep drops usually indicates emotional trading and inconsistent position sizing.
A simple way to structure your insights:
Confident trades → x% win rate, healthy Average RR
Fearful trades   → early exits, reduced R multiples
Greedy trades    → larger position size, heavy drawdowns
Bored trades     → low-quality setups, low expectancy
The goal is not to remove emotions. It is to understand how they influence decisions and define clear rules that protect you when emotions are strong.
Step 4: Metric Calculation and Interpretation
Many retail traders focus only on Win Rate, but this is incomplete. A high win rate can still mean a negative edge if your average loss is much larger than your average win.
For serious review, you need a small set of core metrics. These are standard in tools like UltraTrader and other professional journal solutions.
1. Win Rate
Formula:
WR = Winning trades ÷ Total trades × 100
Win Rate is useful, but dangerous if you look at it alone. A Win Rate of 80–90% might simply mean that you cut winners too early and let losing trades run until they hit a large stop-loss. To better understand the impact of such management decisions, calculate how many small early exits it takes to equal one large stop-out. Doing this math explicitly can counter the ‘loss aversion’ bias and motivate adherence to proper risk-to-reward (RR) rules.
The correct approach is:
- Track Win Rate per setup
- Track Win Rate per symbol
- Track Win Rate per direction (long vs. short)
2. Expectancy / Expected Value (EV)
Formula:
EV = (Win Rate × Average Win) − (Loss Rate × Average Loss)
Expected Value shows how much you make on average per trade over many trades. If EV is positive, the system has a statistical edge. If EV is negative, the system will lose money in the long run, no matter how comfortable it feels.
Journal platforms like UltraTrader calculate EV automatically from closed trades, so you see the actual edge of what you really do, not what you planned to do.
3. Profit Factor
Formula:
PF = Gross profit ÷ Gross loss
Profit Factor combines your Win Rate and Average RR. It is a clear indicator of system quality.
Interpretation:
- Below 1.0 → unprofitable system
- 1.0–1.3 → weak or break-even edge
- 1.3–2.0 → healthy edge with decent risk management
- Above 2.0 → strong system (watch sample size)
4. Average RR (Average Risk-to-Reward Ratio)
Average RR shows how big your average winning trades are compared to your average losing trades.
- Around 2 → typical target for many swing and trend-following strategies
- Around 1 → fragile edge, small changes in fees or slippage can destroy profitability
- Below 1 → your losses are larger than your winners (requires extremely high and stable Win Rate, which is rare)
If Average RR is too low, it usually means:
- You close winners too early due to fear
- You hold losers too long
- You have no clear exit strategy
5. Drawdown and Recovery
Drawdown measures the distance from a peak in your equity curve down to the next trough. It shows the “depth” of your worst periods.
Important questions:
- What is your maximum drawdown?
- How many trades or days did it take to recover?
Dashboard tools and calendar views, such as UltraTrader’s Calendar tab and Daily PNL chart, help you visualize drawdowns, stressful periods, and recovery speed. They show not only the severity of drawdowns but also how long recovery takes. This distinction is crucial, as two equal drawdowns can have very different recovery times. A sharp drawdown that recovers quickly suggests a resilient strategy, whereas a prolonged recovery flags potential issues. Tracking both depth and recovery time gives a more complete view of your risk.
Your equity curve (Finished Trades PNL) is one of the most important visuals. It shows whether your system produces a stable staircase, a noisy rollercoaster, or long periods of flat performance.
You can quickly see:
- Whether your risk management is stable
- Whether one or two massive losses are destroying many small gains
- Whether you are scaling risk in a controlled way
Step 5: Strategy Performance Segmentation
If you trade multiple setups and instruments, you must separate their performance. Aggregated statistics hide reality.
Segment your performance by:
- Setup (breakout, pullback, mean reversion, news, scalp, swing)
- Symbol (EURUSD, gold, NASDAQ, BTC, etc.)
- Direction (long vs. short)
For each segment, calculate:
- Win Rate
- Average win
- Average loss
- Expectancy
- Profit Factor
This segmentation is what the Strategy tab in UltraTrader is designed for. It ranks symbols by PNL, Win Rate, and number of trades, showing where you make money and where you lose capital.
Once you have segmented data, you can make strategic decisions:
- Drop or reduce unprofitable setups
- Increase focus and risk on high-quality setups
- Limit trading on weak symbols or directions
- Adjust position sizing rules per symbol or setup type
Segmentation is where “trade your edge” becomes concrete and measurable.
Step 6: Mistake Identification and Root Cause Analysis
Not all losing trades are bad trades. You have to separate:
- Losses where you followed the plan
- Losses where you broke the plan
- Trades that were not part of the plan at all
A simple classification:
- Type A – Strategy loss: You followed your rules, but the market did not cooperate. This is a normal, acceptable loss.
- Type B – Execution loss: The setup was valid, but you entered late, moved your stop, or exited emotionally.
- Type C – Emotional or random trade: Trade taken out of boredom, FOMO, revenge, or external pressure, not based on your edge.
Label each losing trade with A, B, or C. At the end of the week, review the distribution.
If most of your losses are Type B and Type C, your problem is not the strategy. It is discipline and emotional management. The solution is not to rebuild the system, but to add rules that protect you from yourself.
Step 7: Action Plan and Rule Refinement
A review without concrete action is incomplete.
At the end of each weekly or monthly review, create a small action plan:
- Identify the single most important issue you want to improve
- Write one clear rule or experiment to address it
- Define a testing period (for example, the next 20 trades or next 2 weeks)
- Decide how you will measure success (Win Rate, Expectancy, reduced drawdown, etc.)
Examples:
- If you see that short trades have a much lower Win Rate and worse Average RR than long trades, reduce or temporarily stop short trades.
- If Time Metrics shows that you consistently lose money after a certain hour, set a rule to stop opening new trades at that time.
- If large single-day losses dominate the Daily PNL chart, define a strict daily max loss limit and enforce it.
Tools like UltraTrader help here by letting you filter trades by symbol, direction, time, and other tags. You can verify whether the new rule is improving performance by comparing filtered PNL and metrics before and after the change.
Critical Metrics to Track in Your Review
To keep your trading journal review efficient, focus on a small, high-impact set of metrics.
Core set (must have):
- Win Rate (per setup and direction)
- Expectancy / Expected Value
- Profit Factor
- Average RR
- Maximum drawdown
Secondary metrics (very useful):
- Trade duration and Average Trade Time
- Consecutive wins and consecutive losses
- Long/Short ratio and separate analysis for long vs. short trades
- Symbol performance (best and worst markets)
- Daily and weekly PNL
Cost-related metrics:
- Total fees (spreads, commissions, and other costs)
- Impact of fees on your net PNL
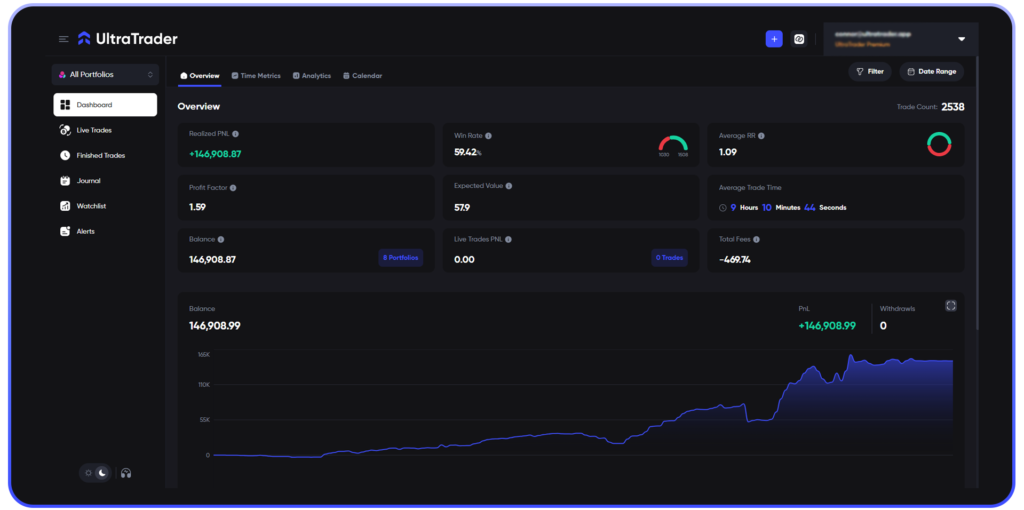
A platform like UltraTrader brings many of these into one Overview dashboard: Realized PNL, Win Rate, Average RR, Profit Factor, EV, balance, Total Fees, and Finished Trades PNL. This gives you a clear control panel for each review session.
Identifying Patterns vs. Random Noise
A common mistake in journal review is drawing conclusions from small sample sizes. The brain tends to see patterns even with fewer than 10 trades. This leads to premature optimization and bad decisions. A simple rule can help guard against this:
A simple rule:
- Less than 10 trades → no conclusion
- 10–20 trades → initial signal, treat it as a hint
- 20–30 trades → pattern is becoming reliable
- 50+ trades → enough data for serious strategy decisions
Apply this rule to:
- Setups
- Symbols
- Time-of-day patterns
- Directional performance (long vs. short)
UltraTrader emphasizes this, especially in Time Metrics and Analytics: aim for at least 30 trades per segment before making big decisions like disabling a symbol or setup.
The Psychology of Review and Behavior Change
Data alone does not change your trading. Your behavior changes when you connect data to rules and enforce them consistently.
Be careful with selective bias. Without a dashboard showing Realized PNL and Finished Trades PNL clearly, it is easy to remember a few big winners and forget the many small losses.
To avoid this:
- Always review the complete data slice, not only your favorite trades
- Start to review your trading journal by looking at losing trades, not winners
- Use objective metrics as your reference, not your feelings about recent trades
The Realized PNL metric in UltraTrader is a strong anchor here. It ignores open trades and “almost hit TP” stories. It shows what actually happened with closed trades during the selected period.
From there, combine:
- Realized PNL
- Profit Factor
- Average RR
- Drawdown and recovery length
Then translate your insights into concrete rules. The link between metrics and rules is where your journal becomes a real performance engine.
Tools and Templates for a Professional Review Workflow
You can run this framework with:
- A simple spreadsheet
- A paper notebook
- A dedicated journal platform like UltraTrader or similar tools

Start Journaling Today

Start Journaling Today
The main difference is speed and objectivity.
Spreadsheets require manual work but are flexible. Paper journals are good for psychology, but slow for advanced metrics. Dedicated dashboards give you instant metrics, clear visuals, and filtering by time, symbol, tag, or direction.
When choosing tools, think about:
- How fast you can log trades
- How quickly you can see Win Rate, Profit Factor, Average RR, EV, and drawdowns
- How easily you can filter and segment your performance
The goal is to make the review process efficient enough to do consistently for years.
Conclusion: Your Journal as a Feedback Engine
Consistent profitability does not come only from “better entries.” It comes from a continuous feedback loop:
Trade → Log → Review → Adjust → Trade with improved rules
Whether you use a spreadsheet, a notebook, or a platform like UltraTrader, the key is the same: log trades accurately, review them systematically, and convert insights into concrete rules with proper testing.
To start, consider committing to this process for 30 days. A month-long trial can lower resistance and leverage small wins, serving as a gateway to habit formation. If you extend this to 3–6 months, you will have:
- A clear picture of where your real edge exists
- An honest view of your behavioral weaknesses
- A set of trading rules that are based on data, not on hope
Your trading journal is not just a history of your trades. It is a structured feedback system that can transform your decision-making and upgrade you from a random trader to a professional risk manager of your own capital.