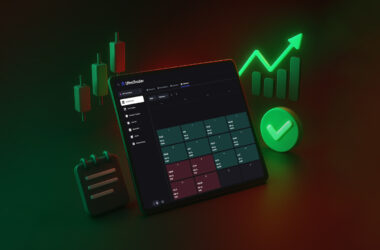

Imagine the anxiety of watching your hard-thought strategy crumble in real time. You meticulously planned every move, only to see your profits decrease with each tick of the market. Every serious trader hits the same wall: the strategy looks great in theory, but the equity curve tells a different story. A structured trading journal is the bridge between “I think I’m profitable” and “I know exactly where my edge is”, and if you are starting out, an Excel trading journal template is a powerful way to bring order to your trades; but as your volume grows, a dedicated app like UltraTrader becomes the smarter, scalable upgrade.
Why You Cannot Skip A Trading Journal
A trading journal is more than a log; it is your personal performance database and the fastest way to turn random trades into a repeatable system. By tracking entries, exits, context, and outcomes, you can see which setups actually work, how emotions affect decisions, and whether your risk management holds up in real time.
Key benefits of keeping a trading journal include:
- Improved decision‑making: reviewing past trades replaces guesswork with hard data.
- Increased discipline: You are far less likely to revenge‑trade when you know every mistake will be documented.
- Shorter learning curve: structured review accelerates experience; you stop repeating the same errors month after month.
For traders searching for trading journal templates or ways to track trades, a well‑designed Excel workbook is often the first step toward building this habit.
Inside This Excel Trading Journal Template
This Excel trading journal template is built specifically to move you away from random screenshots and chaotic notes and into a clean, structured workflow. It is organized into dedicated sheets: Journal, Dashboard, Settings, and Tutorial; so you can start tracking trades in minutes instead of building formulas from scratch.
On the Journal sheet, every trade lives on its own row with:
- Date and time (YYYY‑MM‑DD and HHMMSS)
- Pair or symbol (for example, BTCUSDT, EURUSD, AAPL)
- Strategy (eg. Trend Following, Breakout, Mean Reversion, Scalp, Swing, HODL)
- Direction (Long or Short) and status (Open or Closed)
- Leverage or contract size, entry price, exit price, stop loss
- Position size, fees, notes, auto‑calculated Net PnL, realized R:R, and cumulative PnL per trade.
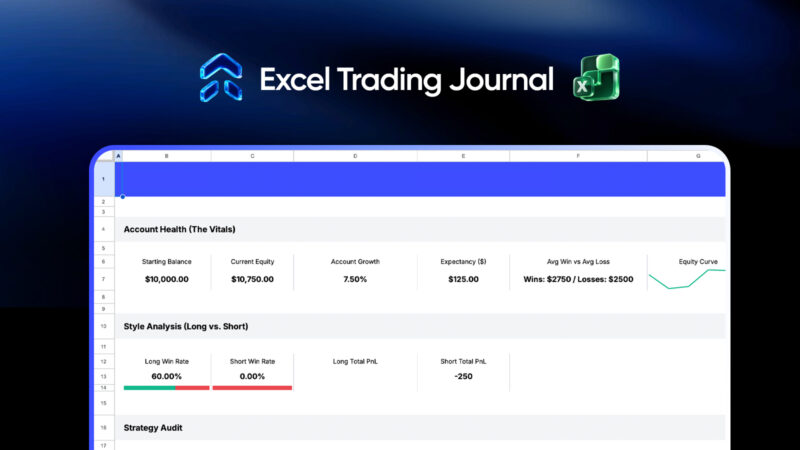
The Dashboard sheet converts this raw data into an at‑a‑glance performance snapshot showing:
- Account Health: starting balance, current equity, account growth, expectancy, average win vs average loss, and an equity curve.
- Style Analysis: long vs short win rate and total PnL, so you can see which side of the market actually suits you.
- Strategy Audit: trade count and total PnL per strategy, highlighting which playbook should get more capital and which should be cut.
The Settings and Tutorial sheets walk you step‑by‑step through setup, including position sizing conventions across Forex, gold, crypto, and stocks, so even newer traders can journal correctly from day one.
The Limits Of Excel As Your Trading Grows
Excel and Google Sheets have real strengths: it is flexible, accessible, and fully under your control, which is why spreadsheet‑based trading journals remain popular among active traders. But once you start logging dozens or hundreds of trades per month, its weaknesses show up fast.
Some of the biggest friction points are:
- Manual data entry: copying trades from your broker into rows is time‑consuming and prone to errors, especially for day traders and scalpers.
- Formula maintenance: one broken cell or accidental edit can corrupt expectancy, PnL, or equity curves; and you may not notice until weeks later.
- Scaling issues: large workbooks with thousands of trades become slow; adding charts or extra analytics often requires intermediate Excel skills.
- Limited analytics: segmenting performance by symbol, session, hour of day, day of week, or long vs short requires complex filters and custom pivots.
At some point, you want to spend less energy massaging spreadsheets and more time interpreting clean, automated analytics. That is where a dedicated trading journal app beats even the most polished Excel file.
UltraTrader: The Smarter Upgrade To An Excel Journal
UltraTrader is an automated trading journal app for crypto, forex, stocks, and commodities that turns your historical trades into a live performance lab. Instead of manually inputting every fill, you connect supported brokers and exchanges and let UltraTrader import trades for you.

Start Journaling Today

Start Journaling Today
Where Excel gives you static tables and a simple dashboard, UltraTrader gives you a multi‑tab analytics engine built around four core views:
- Overview: Realized PNL, Win Rate, Average Risk‑Reward, Profit Factor, Expected Value per trade, equity‑style charts, total fees, and finished trades PnL.
- Time Metrics: Intraday vs multiday performance, average hold time for winners vs losers, day‑of‑week PnL, hourly PnL, and trade counts by hour.
- Analytics: Symbol performance by PnL, Win Rate, or trade count, long vs short stats, best and worst symbols, long/short ratio, and largest win vs largest loss.
- Calendar: Year and month views that color‑code profitable vs losing days and summarize trades, Win Rate, and PnL by week and month.
All of this runs on desktop and mobile, with dashboards that are ready immediately, so you can focus on reading the story of your trading rather than building charts.
Why UltraTrader Is The Better Alternative
If you are currently using or considering an Excel trading journal, UltraTrader is the natural next step once you care about speed, reliability, and deeper insight. Compared to spreadsheets, it offers several concrete advantages.
Automatic trade import
Sync supported brokers and exchanges once and let UltraTrader handle data entry for you.
This eliminates typos and missing trades, which are common problems in manual Excel workflows.
Richer analytics without formulas
Metrics like Profit Factor, Expected Value, and Average RR are pre‑built, along with symbol and time‑based breakdowns that would take hours to create in Excel.
Visuals such as finished trades equity curves, daily and weekly PnL bars, and performance heatmaps appear automatically as new trades sync.
Deeper behavioral insight
Time Metrics and Calendar tabs highlight when you trade best or worst by hour, weekday, week, or month, so you can adjust session rules and risk.
Long vs short analyses, largest loss vs largest win, and symbol‑level stats make it obvious where your discipline breaks down.
Better accessibility and consistency
UltraTrader runs on both mobile and desktop, so your journal is always in sync; you do not juggle multiple spreadsheet versions across devices.
This solves a major Excel pain point: fragmented files and inconsistent data when you switch between a laptop, an office PC, and a phone.
Built for active traders
Whether you are logging a few swing trades per week or dozens of intraday positions per day, UltraTrader handles scale without slowing down.
For prop traders and high‑frequency users, automated logging and fast filtering can be the difference between reviewing your performance daily vs “when you find time”.
UltraTrader directly serves intents around trading journal apps and automated journaling while still being an ideal upgrade path for traders who begin with an Excel trading journal template.
How To Move From Excel To UltraTrader
The best way to maximize this Excel trading journal and set yourself up for a smooth transition is to think in stages.
Stage 1: Build the habit with Excel
Use the provided template for your next 20–30 trades, ensuring each row is complete: date, time, symbol, strategy, direction, size, entry, exit, stop, fees, and notes.
Review the Dashboard weekly, paying close attention to account growth, average win vs loss, strategy audit, and long vs short performance.
Stage 2: Identify what Excel cannot answer easily
Ask questions like which hour hurts you most, whether you actually make money on Fridays, or which symbol is your silent killer, and notice where Excel feels slow or clumsy.
These are precisely the questions UltraTrader’s Overview, Time Metrics, Analytics, and Calendar tabs are designed to answer quickly.
Stage 3: Upgrade to UltraTrader for deeper analytics
Create your account, connect your broker or exchange where possible, and let UltraTrader start ingesting trades automatically.
Import your existing history so your past trades instantly power UltraTrader’s dashboards, and you can see long‑term patterns you might have missed in Excel.
By combining an Excel trading journal template for initial structure with UltraTrader’s automated analytics once your data grows, you get the best of both worlds: full control when you start, and a powerful, always‑on trading intelligence layer as you scale. If you are serious about improving your results—not just your screenshots—start journaling today and let UltraTrader handle the heavy lifting once your spreadsheet starts to hold you back.