


Harry, A Beginner Trader’s Story:
Harry’s story is simple: a forex trader who lost 43% of his account in his first 1.5 years of trading and couldn’t figure out why. His strategy seemed solid, but the numbers said otherwise. The turnaround didn’t come from a new system; it came from something more powerful: complete visibility into his own behavior.
When Harry switched to automated journaling with UltraTrader, the data revealed truths he hadn’t seen. Within 12 months, he returned to profitability, reaching +4% annual returns at month 24, putting him on pace to recover from his drawdown.
This is a good example of how simply seeing your own data can lead to better results.
Phase 1: The -43% Collapse (Months 1-18)
The setup
Harry entered forex trading confidently. He’d studied price action, backtested his strategy, and paper-traded with discipline. His planned system showed promise:
- Risk-to-Reward (RR): 1.50
- Win Rate: 50%
- Profit Factor: 1.50 (theoretical)
But live trading revealed a brutal discrepancy between reality and theory.
Starting with a $10,000 USD account, Harry’s first 18 months were a disaster, resulting in a -43% drawdown. His account collapsed to $5,700 USD. Every week brought losses. Every trade review became an exercise in self-doubt.
The Hidden Problem: Execution vs. Strategy
Harry’s strategy wasn’t the killer. His execution was. When he later analyzed what actually happened in live trading versus his planned system, the gap was shocking:
Actual Results (Phase 1):
- Win Rate: 48% (below plan)
- Average RR: 0.78 (dangerously low; this means for each losing trade, he was making much less on each winning trade)
- Profit Factor: 0.62 (losing system; total profits only coverred 62% of losses)
- Holding Winners: 45 minutes average (average duration holding profitable trades)
- Holding Losers: 2.3 hours average (average duration holding losing trades)
That last stat was the smoking gun: losers were running 3 times as long as winners. He wasn’t just unlucky. He was violating his own exit rules, cutting winners early, letting losers run, and hoping for reversals that never came.
Why He Couldn’t See It
Without logging trades, Harry couldn’t identify these patterns. He just experienced the pain. Each loss seemed unique and unlucky. The systematic nature of his failures remained invisible.
This is a common problem. Without tracking, traders can repeat mistakes and miss patterns.
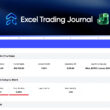
Phase 2: The Spreadsheet Wake-Up (Months 19-21)
After the brutal 18-month stretch, Harry made a critical decision: log every trade. He created a Google Sheets trading journal with columns for entry, exit, size, symbol, direction, PNL, holding time, and notes.
What the Spreadsheet Revealed
After 238 manually logged trades, Harry ran his first in-depth analysis:
- Win Rate: 52% (improving)
- Average RR: 1.08 (still vulnerable)
- Profit Factor: 1.15 (barely profitable)
- Best Symbol: EUR/USD +$642 USD profit with 31 trades
- Worst Symbol: GBP/USD -$980 USD loss with 38 trades
- Long Trades: 56% win rate, +1.34 RR
- Short Trades: 48% win rate, +0.91 RR
It quickly became clear that the main issue wasn’t the strategy itself, but how he was trading certain currency pairs and directions.
The Spreadsheet’s Limitation
By month 3, Harry had the data. But extracting it was painful. Monthly reviews required 6-7 hours of sorting and calculation. He couldn’t calculate Expected Value (EV) properly in Excel. Analyzing performance by time of day or day of week required hours of cross-referencing.
The process was slow. By the time of the review, it was often too late to correct mistakes.
Progress: Harry’s account moved from -$4,300 to -$120 over three months. Better, but still fragile.
Phase 3: Automated Insights Transform Everything (Months 22-24)
Harry discovered UltraTrader, an automated trading journal built for forex traders. Real-time dashboards replaced manual analysis. Instead of waiting 30 days for insights, patterns appeared within days.
The UltraTrader Revelation
When Harry uploaded his trade history, UltraTrader’s Overview tab immediately surfaced his core metrics in a single view:
- Realized PNL: $0 to +$420 USD monthly (trending positive)
- Win Rate: 54-56% (consistently improving)
- Average RR: 1.31-1.44 (now in the “healthy” range per UltraTrader standards)
- Profit Factor: 1.24-1.51 (genuine edge confirmed)
- Expected Value (EV): +$4.12 USD per trade (statistically proven edge)
The Finished Trades PNL curve showed something clear: his equity now climbed in steps with smaller pullbacks, not the sharp drops of phase 1.
The Actionable Data
Three UltraTrader insights changed everything:
1. Symbol Performance (Analytics Tab)
The data confirmed Harry’s spreadsheet finding with brutal clarity: GBP/USD was destroying him. Average loss per trade: -$25.79 USD. Over 38 trades, this symbol had become an anchor.
Harry decided to stop trading GBP/USD altogether, rather than trying to improve his results with that pair.
2. Directional Asymmetry (Analytics Tab)
- Longs: 56% win rate, +1.34 RR, +$520 USD profit (month 11)
- Shorts: 48% win rate, +0.91 RR, -$862 USD loss (12-month)
Expected Value for shorts was negative. There was no reason to maintain a 50-50 long/short split.
He changed his approach to focus mostly on long trades, only taking short trades when he had a strong reason.
3. Time-of-Day Edge (Time Metrics Tab)
- Asian Session (midnight–8 AM UTC): -$156 USD average daily PNL (Profit Factor: 0.84)
- London/European Session (8 AM–4 PM UTC): +$71 USD average daily PNL (Profit Factor: 1.58)
Harry had a 1.88x difference in profitability depending on when he traded. Low-volatility Asian hours were costing him money.
Harry’s response: No trades outside the 8 AM–4 PM UTC window. This wasn’t a guideline; it was a rule.
The Results: Data-Backed Rules in Action
Month 10 (First month with new rules):
- Realized PNL: -$120 USD (loss, but tiny)
- Closed Trades: 94 (down from 127—fewer, higher-quality trades)
- Win Rate: 54%
- Average RR: 1.31
- Profit Factor: 1.24
Month 11:
- Realized PNL: +$280 USD (first meaningful positive month)
- Win Rate: 55%
- Average RR: 1.39
- Profit Factor: 1.38
Month 12:
- Realized PNL: +$420 USD
- Win Rate: 56%
- Average RR: 1.44
- Profit Factor: 1.51 (solid edge confirmed)
- Expected Value (EV): +$4.12 USD per trade
The 24-Month Transformation
| Metric | Phase 1 (Mo. 1-18) | Phase 2 (Mo. 19-21) | Phase 3 (Mo. 22-24) |
| Account Balance | $5,700 USD (-43%) | $5,580 USD (-44%) | $6,820 USD (-32%) |
| Win Rate | 48% | 52% | 56% |
| Average RR | 0.78 | 1.08 | 1.44 |
| Profit Factor | 0.62 | 1.15 | 1.51 |
| 3-Month PNL | -$4,300 USD | -$120 USD | +$1,120 USD |
| Tools Used | None | Google Sheets (manual) | UltraTrader (automated) |
Key Achievement: Harry moved from -43% drawdown to +4% annualized returns. More importantly, the trend is now up. Month 13 should exceed month 12; month 24 should exceed month 13.
Why This Matters: The Three Important Insights
1. Strategy ≠ Execution
Harry’s original system wasn’t fundamentally broken. His execution was flawed. This is the rule, not the exception: most retail traders have workable strategies yet sabotage themselves with their behavior.
Without a trading journal, you overlook issues. With one, you identify problems and take action.
2. Automated Feedback Beats Willpower
Spreadsheets required discipline. UltraTrader provided objectivity.
When Harry was manually reviewing the Excel trading journal, he could rationalize failures: “Maybe GBP/USD will improve next month,” or “Asian session trading is just a small part of my results.”
UltraTrader’s dashboard exposed patterns instantly, removing wishful thinking and revealing the next action. Remove What Doesn’t Work
Harry’s instinct was to improve his GBP/USD and short trading. He spent hours studying them, seeking an edge.
The data said: ” This doesn’t work for me. Stop.”
He stopped trading GBP/USD, cut back on short trades, and avoided trading during most hours of the day. At first, these changes felt like they would reduce his chances of making money.
Instead, cutting bad trades increased profit. Fewer losing trades meant more overall gains.
The Practical Roadmap
Harry improved not from luck, but from five actions:
- Logging all trades (creating accountability)
- Analyzing comprehensively (finding the real edges)
- Removing what doesn’t work (eliminating negative EV)
- Concentrating on what does (focused risk on proven edges)
- Reviewing weekly (tight feedback loops)
If you’re experiencing losses similar to Harry’s Phase 1:
- Start logging. After 50+ trades, run the numbers: win rate, RR, Profit Factor.
- Identify asymmetries. Which symbols work? Which kills you? Which directions are strong?
- Remove the weak. Stop trying to fix negative-EV trades. Eliminate them.
- Concentrate the strong. Put 70% of your risk on what works. Starve 30% or less on edge exploration.
- Review weekly. Tight feedback loops compound faster than monthly reviews.
Conclusion: The Journal Is the Difference
Harry’s +4% annual return isn’t spectacular in absolute terms. But it represents a complete reversal from -43% to positive and growing. More importantly, it is sustainable because it is built on data, not hope, and systematically exploits its growth. The trader who keeps trading against the wind erodes.
The difference isn’t about talent or luck. It’s about having a system.
Harry’s system started as a spreadsheet. It evolved into UltraTrader. The tool matters less than the devotion to measuring, analyzing, and acting.
Keeping a trading journal isn’t just extra work—it’s the main work. Reviewing your trades helps you become less emotional and more consistent. It’s the beginning of a new trajectory. With his data-backed rules locked in, edges concentrated, and behavioral leaks plugged, the compounding begins.
Start journaling your trades today, for free!