


The Ichimoku Cloud is a powerful tool for technical analysis in trading, though many traders initially find it complicated due to its multiple lines and signals.
Ichimoku is more than just an indicator; it is a complete trading model that answers five key questions:
1. What is the current trend?
2. Is the price strong or weak in that trend?
3. Where are the support and resistance levels?
4. When is a good time to enter a trade?
5. Where can I logically place a stop loss?
Most indicators provide only one type of information, while Ichimoku combines them all.
This guide explains how Ichimoku works, how to read it, and how to create trading strategies with it. You will learn to:
– Read the five Ichimoku lines
– Understand strong versus weak signals
– Spot high-probability breakouts
– Avoid common traps
Goichi Hosoda developed Ichimoku Kinko Hyo in the 1930s to provide a quick view of the market. Ichimoku means “one glance,” and Kinko Hyo means “equilibrium chart.” Together, they signify seeing balance in the market at a glance.
What Is Ichimoku Cloud?
The Ichimoku Cloud (sometimes called Ichimoku Kinko Hyo) is made of five main elements:
- Tenkan-sen
- Kijun-sen
- Senkou Span A
- Senkou Span B
- Chikou Span
When you plot these lines, you also get a colored cloud, called the Kumo. The Kumo indicates future support and resistance levels, and also shows whether the market is bullish or bearish.
Here is a basic summary of how traders use it:
- If the price is above the Cloud, the trend is bullish.
- If the price is below the Cloud, the trend is bearish.
- If the price is inside the Cloud, the market is in a neutral or uncertain zone.
The Ichimoku Cloud is unique because some of the lines are projected forward into the future, while others are projected backward. So the indicator is not only reacting to price. It attempts to predict balance, future structure, and significant potential future zones.
In other words, it is not only “what is happening now”, it is also “what might act as support or resistance next”.
This is why many professional traders still use it today in forex, crypto, stocks, and indices.
Now we will break down each line in detail.
The Five Components Explained
1 Tenkan-sen (Conversion Line)
Formula:
(Highest high of last 9 periods + Lowest low of previous 9 periods) ÷ 2
Meaning:
The Tenkan-sen is a short-term line. It reacts fast to price. It is a short-term balance point.
How to read it:
- A rising Tenkan-sen means short-term bullish pressure.
- A falling Tenkan-sen means short-term bearish pressure.
- A flat Tenkan-sen means the price is ranging.
Use:
- It can act like a dynamic short-term support or resistance.
- It is often used as a trigger line for entries.
2 Kijun-sen (Base Line)
Formula:
(Highest high of last 26 periods + Lowest low of previous 26 periods) ÷ 2
Meaning:
The Kijun-sen is the medium-term balance line. It is slower than the Tenkan-sen. Many traders call it the anchor.
How to read it:
- If the Kijun-sen is flat, the market is losing momentum and may pull back.
- If the price is far above the Kijun-sen, the market may be overextended.
- If the price returns to the Kijun-sen and finds support there, the bullish trend remains healthy.
Use:
- Many Ichimoku traders use pullbacks to the Kijun-sen as entry areas in a trending market.
- You can also use the Kijun-sen as an initial stop-loss level.
Tip: In a strong uptrend, the price often bounces on the Kijun-sen again and again. When it stops bouncing and breaks below Kijun-sen with force, something has changed.
3 Senkou Span A (Leading Span A)
Formula:
( Tenkan-sen + Kijun-sen ) ÷ 2, plotted 26 periods in the future
Meaning:
This is one edge of the Cloud (Kumo). Since it is pushed forward on the chart, it indicates a potential future area of support or resistance.
Use:
- In a bullish trend, the Senkou Span A is typically positioned at the top of the Cloud.
- In a bearish trend, the Senkou Span A is generally located at the bottom of the Cloud.
4 Senkou Span B (Leading Span B)
Formula:
(Highest high of last 52 periods + Lowest low of previous 52 periods) ÷ 2, plotted 26 periods in the future
Meaning:
This is the second edge of the Cloud. It is slower and more stable than Span A. It often marks firm support or resistance.
Use:
- When Span B is flat, it often acts like a magnet. Price tends to respect flat Span B as a key level.
- If Span B is flat across many candles, that level is often difficult to break.
5 Kumo (the Cloud)
The Cloud is simply the area between Senkou Span A and Senkou Span B.
It is usually colored green when Span A is above Span B (bullish), and red when Span A is below Span B (bearish).
How to read the Cloud:
- Thick cloud = strong structure, stronger defense against breakouts.
- Thin cloud = weak structure, easier to break.
If the price is above a bullish (green) cloud, you have a strong bullish market.
If the price is below a bearish (red) cloud, you have a strong bearish market.
If the price is inside the Cloud, you have indecision.
6 Chikou Span (Lagging Span)
Formula:
Current closing price, plotted over the past 26 periods.
Meaning:
This line indicates where the current price stands in relation to past prices. It helps confirm momentum and the strength of the trend.
How to read it:
- If the Chikou Span is above the past price, bullish momentum is confirmed.
- If the Chikou Span is below the past price, bearish momentum is confirmed.
- If the Chikou Span is stuck inside past candles, the market is messy and not clean.
You can think of Chikou Span like this: Is the current market clearly stronger than it was 26 candles ago, or not?
Trading Strategies with Ichimoku Cloud
Now we will build actual trading plans.
We will cover:
- Tenkan-Kijun cross
- Kumo breakout
- Kijun-sen pullback entry
- Trading with multi-timeframe confirmation
1st Strategy: Tenkan-Kijun Cross
This is one of the most famous Ichimoku signals.
Rules for a bullish signal:
- Tenkan-sen crosses above Kijun-sen.
- Where is the price when this happens?
- Above the Cloud: strong signal
- Inside the Cloud: medium signal
- Below the Cloud: weak signal
How to trade it in a bullish context:
- You can enter long on the candle that confirms the cross, but only if the signal is strong.
- You can place a stop loss below the Kijun-sen or below the nearest swing low.
- You can target the previous high or hold until the Tenkan crosses back below the Kijun.
Tip: Do not take every cross. Only consider crosses in the direction of the cloud trend. If the Cloud is bearish, ignore bullish crosses. You will filter a lot of bad trades this way.
2nd Strategy: Kumo Breakout (Cloud Breakout)
This is a trend following strategy.
Rules for a bullish breakout:
- Price was below the Cloud or inside the Cloud.
- Price breaks above the entire Cloud and closes above it.
- The future Cloud is already bullish or is expected to turn bullish.
- Chikou Span is above the past price.
This is a sign that the market may be starting a new upside trend.
Entry idea:
- Enter long after the first candle that fully closes above the Cloud.
- Use the top of the Cloud (Senkou Span A or B, whichever is lower at that moment) as your initial stop loss.
- As the price moves up, trail the stop under Kijun-sen.
Extra filter:
- Look for a thick cloud below the price. A dense cloud means strong new support. If the Cloud below you is thin, the breakout may fail fast.
3rd Strategy: Kijun-sen Pullback
This strategy is used to capitalize on an already established trend.
Rules for bullish setup:
- Price is above the Cloud.
- Cloud is bullish and not thin.
- Price pulls back toward Kijun-sen.
- Price finds support near the Kijun-sen and rejects it (for example, a candle with a long lower wick or a bullish engulfing pattern after touching the Kijun-sen).
Entry idea:
- Enter long at or just after the bounce from Kijun-sen.
- Stop loss slightly below Kijun-sen or below the swing low of the pullback.
- The first target can be the recent high. You can then partially take profit and trail the rest.
Why this is powerful:
You do not chase breakouts. You wait for pullbacks to value. This improves the risk-to-reward.
You are basically saying: “The market is bullish. I want discount entries inside that bullish context.”
4th Strategy: Multi-Timeframe Alignment
This is an advanced yet crucial technique.
Idea:
- Use a higher timeframe to confirm the primary trend.
- Use a lower timeframe to time entries.
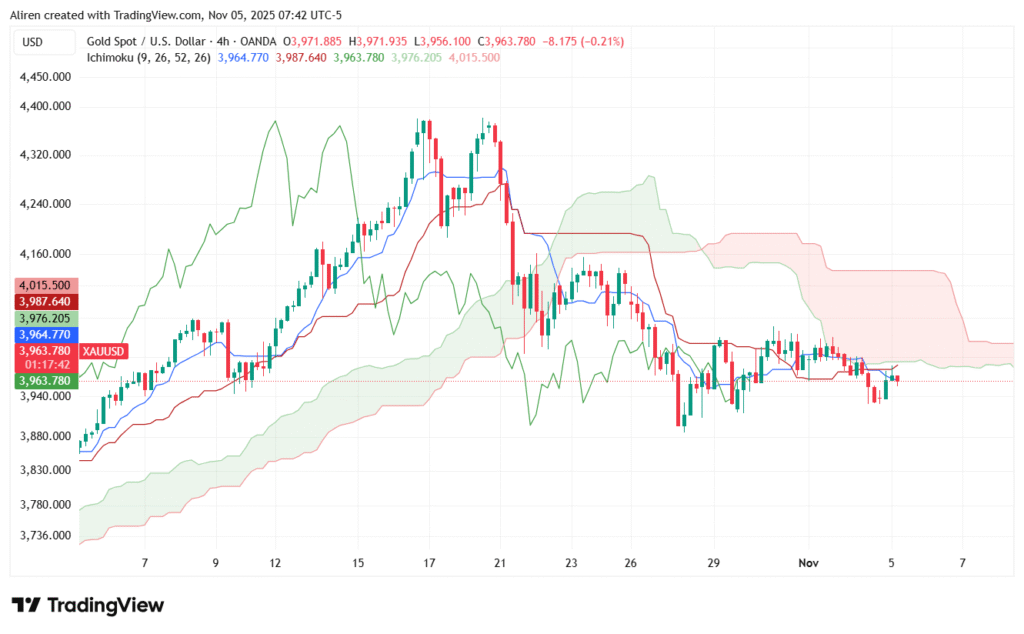
Example:
- On the 4-hour chart, the price is above the Cloud, indicating a bullish cloud.
- On the 1-hour chart, you wait for a Tenkan-sen cross above Kijun-sen or a Kijun-sen pullback bounce.
Why this works:
The higher timeframe defines direction. The lower timeframe gives you precision. You receive trades that are neither random nor late.
This approach also keeps you from trading counter-trend. If the 4-hour chart is bearish, you skip long setups on the 1-hour chart. You wait for short setups only.
Common Mistakes to Avoid
Even good traders make these mistakes when they first learn Ichimoku. Try not to repeat them.
1 Treating Every Cross as a Trade Signal
Tenkan-sen crossing Kijun-sen is not enough by itself. You must also check:
- Where is the price relative to the cloud?
- What does Chikou Span say?
- Is the future cloud bullish or bearish?
If the rest of the system does not agree, skip the trade.
2 Trading Against the Cloud
Some traders try to guess bottoms by buying under a bearish cloud. This is very risky. When the price is below the cloud and the cloud is bearish, the market is indicating that sellers are in control.
It is usually smarter to trade in the direction of the cloud.
3 Ignoring Higher Timeframes
You might see a bullish signal on the 15-minute chart, but the 4-hour chart is strongly bearish. In that case, your bullish signal is fighting the primary trend. That means lower probability and higher stress.
If you only follow one tip from this whole guide, follow this one:
Always consider the higher timeframe context before entering.
4 Entering Inside the Cloud
We said it already, but it is worth saying again.
When the price is inside the Kumo, the market structure is not clear. Many fake breakouts start from inside the cloud and then die. Waiting for a clean break above or below the cloud will save you money over time.
5 No Stop Loss Because The Cloud Will Save Me
Some traders believe the cloud will always act as support or resistance, protecting them. That is dangerous thinking.
Yes, the cloud often holds price. However, when it breaks, it can break quickly and severely. Always protect yourself with an apparent stop loss based on structure.
Conclusion
The Ichimoku Cloud is a valuable tool if you know how to read it. Here are the main points from this guide.
Ichimoku is a complete trading system. It shows trends, momentum, and support and resistance levels. You may not need other indicators often.
Know what each line does.
– Tenkan-sen indicates short-term balance.
– Kijun-sen shows medium-term control.
– Senkou Span A and B form the cloud, showing future support and resistance.
– Chikou Span confirms trend quality by comparing the current price to the past price.
Watch The Cloud
– Prices above the cloud are bullish.
– Prices below the cloud are bearish.
– Prices inside the cloud show indecision.
Use Signal Strength
A Tenkan-Kijun cross above a bullish cloud with a clear Chikou Span is potent. The same cross below a bearish cloud is weak and usually should be ignored for long trades.
Trade With A Plan
Good entries include breakouts from the cloud, accompanied by volume and Kijun-sen pullbacks, in a strong trend. Chasing random candles can lead to losses. Use a professional trading journal like UltraTrader that helps you keep track of your trades.

Start Journaling Today

Start Journaling Today
Manage Your Risk
Ichimoku can help with stop-loss levels, but you still need a plan for stop-loss, take-profit, and position size.
Final Note
You master Ichimoku through practice, not just reading. Choose a market you know, apply Ichimoku, and identify bullish or bearish conditions. Watch how price interacts with the Kijun-sen and the cloud.
When you can quickly assess the trend, momentum, and entry points on a chart, you’ll be using Ichimoku effectively.