


Welcome to the step-by-step guide to using the market insights in the portfolio optimizer.
This guide assumes you have basic knowledge of crypto but no prior experience with the tool. By the end, you’ll know how to leverage its features to identify opportunities, manage risks, and build a resilient portfolio.

Remember, crypto markets are volatile and can humble even the best traders. This tutorial emphasizes practical usage with strong risk management; always invest only what you can afford to lose and do your own research (DYOR).
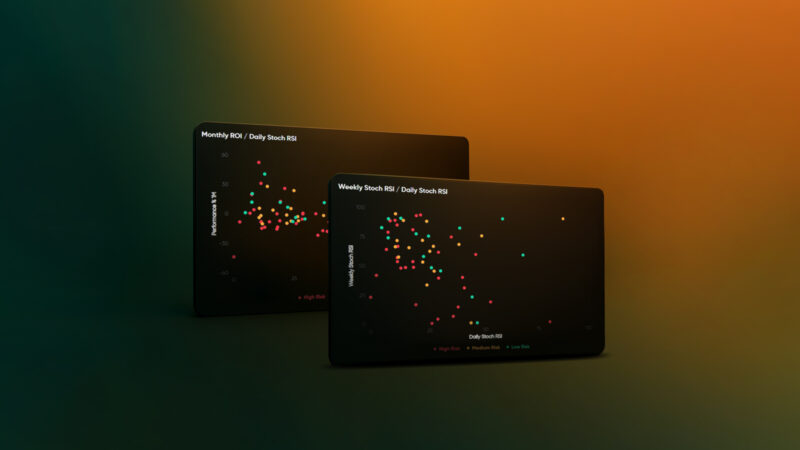
Understanding and Using Chart 1 (Monthly Performance vs. Stochastic RSI)
This chart provides a medium- to long-term view to spot momentum and correction opportunities.
- Axes Breakdown:
- Y-Axis: Monthly performance percentage (higher = stronger momentum, e.g., +20% or more indicates positive trends).
- X-Axis: Stochastic RSI (left/low = oversold <30, right/high = overbought >70).
- Quadrant Interpretation:
- Upper-Left: High performance but oversold—ideal buys (strong momentum post-correction).
- Upper-Right: High performance and overbought—potential sell or wait for pullback.
- Lower-Left: Low performance and oversold—possible recovery buys, but risky if downtrend persists.
- Lower-Right: Low performance and overbought—strong sell signal.
- Center (moderate performance ~0-10%, RSI ~50): Direction unclear; the coin isn’t showing strong bullish or bearish signals. Avoid major actions here—monitor for movement or use Chart 2 for confirmation.
How to Use It:
- Load the chart and hover over points to see coin details.
- Identify targets: Look for upper-left coins to add to your portfolio.
Examples in Action:
- Chain Link (Link, Low Risk): Upper-left (+25% performance, RSI <30). How to use: Buy more Link as it corrects in a bull trend. Add to your core holdings for stability.
- Litecoin (LTC, Low Risk): Lower-left (-8% performance, RSI <30). How to use: Accumulate LTC during dips.
- Polcadot (DOT, Medium Risk): Upper-right (+33% performance, RSI >70). How to use: Take profits from Polcadot; reallocate to safer assets.
- Solana (SOL, Low Risk): Upper-right (~27% performance, RSI ~68). How to use: Move your stop-loss higher to get the most of your position.
Always cross-check with market news before acting.
Understanding and Using Chart 2 (Weekly vs. Daily Stochastic RSI)
This chart compares short-term (daily) and medium-term (weekly) momentum for timing entries/exits.
- Axes Breakdown:
- Y-Axis: Weekly Stochastic RSI (higher = medium-term overbought >80).
- X-Axis: Daily Stochastic RSI (left/low = short-term oversold <20).
- Quadrant Interpretation:
- Upper-Left: Weekly overbought, daily oversold—buy on short-term dip in a medium-term uptrend.
- Upper-Right: Both overbought—sell or hedge against correction.
- Lower-Left: Both oversold—potential bottom, but confirm recovery.
- Lower-Right: Weekly oversold, daily overbought—take short-term profits in a downtrend.
- Center (both RSIs ~50): Neutral momentum; no clear direction. Hold off on trades—wait for divergence or use external indicators.
How to Use It:
- Switch to Chart 2 and compare with Chart 1 for validation.
- Time your moves: Enter upper-left positions; exit upper-right ones.
- Optimize Portfolio: The tool suggests rebalances, e.g., reduce exposure to overbought coins.
Examples in Action:
- Ethereum (ETH, Low Risk): Upper-left (weekly >80, daily <20). How to use: Buy ETH during daily dips—perfect for HODLing.
- Poligan (POL, Medium Risk): Upper-right (both >80). How to use: Trim POL holdings amid overbought signals from app integrations.
- Cake (CAKE, High Risk): Lower-left (weekly <50, daily <10). How to use: Cautiously buy only if hype builds; set tight stop-losses.
- Avalanche (AVAX, Low risk): Upper-left (weekly >80, daily <40). How to use: Add AVAX for its speed, but diversify to avoid subnet risks.
Combine charts: If a coin is located in the upper-left quadrant of both, it’s a high-confidence buy.
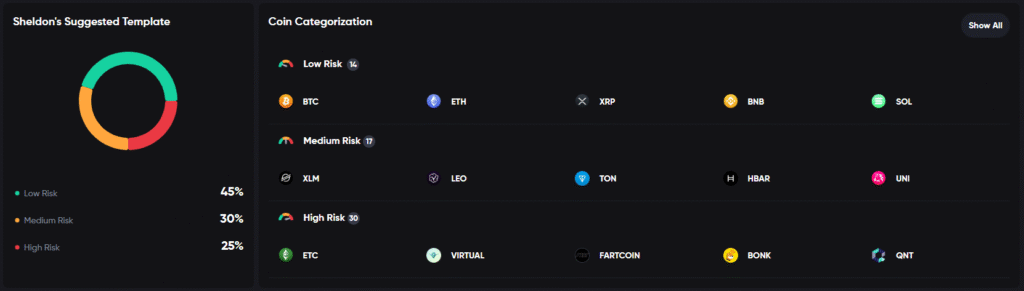
Implementing Risk Management
Risk management is non-negotiable—markets can turn quickly and humble you.
Diversify: Balance low-risk, medium-risk, and high-risk.
Stop-Losses and Take-Profits: Set orders, e.g., sell if it drops 15% from entry.
Monitor Regularly: Revisit charts daily/weekly; set alerts for quadrant changes.
Emotional Check: Avoid FOMO or panic—stick to data. If humbled by a loss, review and adjust strategy.
Example: If DOGE shifts to the lower-right in Chart 1, sell immediately to preserve capital.
Optimizing Your Portfolio in Practice
- Assess Current Holdings: Load your portfolio and see where your coins are plotted.
- Identify Actions: Buy upper-left, sell upper-right, hold neutrals.
- Simulate and Execute: Test rebalances (e.g., shift from overbought TON to oversold ETH), then trade via linked exchanges.
- Review Performance: Track changes over time and adjust accordingly based on results.
Real Scenario: Portfolio heavy in high-risk DOGE (center in both charts)? Reduce to 5%, and add low-risk BTC in the upper-left corner for balance.
Who This Tool Is For and Final Tips
This optimizer suits beginners learning visuals, intermediates timing trades, and pros optimizing large portfolios.
Final tip: Markets evolve; update your knowledge and use the tool alongside news/on-chain data.