


If you’ve completed our “Introduction to Forex Candlestick Patterns” article, you’re familiar with the basics. Now it’s time to enhance your candlestick analysis skills like seasoned forex traders.
In this blog post, we’ll go through 7 advanced patterns, the psychology behind them, and practical strategies to turn signals into profitable trades. You’ll learn to read the market better, avoid costly mistakes, and create a personalized trading plan. Combine these skills with tools like a trading journal for success in forex trading.
The Psychology behind Candlestick Patterns
Candlestick patterns represent traders’ emotions and offer insights into price movements in forex markets. Each candle tells a story of fear, greed, or uncertainty. For example, a Doji signals indecision, while a Marubozu shows strong buyer dominance, indicating a momentum breakout.
Key patterns like a Bullish Engulfing at a support level reveal buyer strength against sellers. To make informed trading decisions, consider the market’s emotional context alongside current events and trends. By understanding these psychological cues, you can improve your trading strategy.
Creating a Strong Trading Strategy Based on Candlestick Patterns
To master candlestick trading, you need a clear strategy that translates patterns into profits. This guide outlines how to develop a candlestick trading strategy focusing on setups, entry and exit rules, and risk management for forex pairs like EUR/USD and USD/JPY.
Select patterns that match your trading style. Scalpers might use the Harami pattern on 5-minute charts for quick trades, targeting 10-20 pips, while swing traders may look for Three White Soldiers on daily charts, aiming for 100-200 pips.
Establish clear entry rules, such as trading patterns at key levels, like the Piercing Line at 1.0900 for EUR/USD, confirmed by indicators like an RSI under 30. Set stop-loss orders just outside the pattern’s range and aim for a risk-reward ratio of 1:2 or 1:3.
Risk management is crucial. Limit your risk to 1-2% of your account balance per trade. For a $10,000 account, that’s a maximum loss of $100-$200. Determine your position sizes accordingly and practice on a demo account while maintaining a trading journal to track patterns and results.
Review your trading journal regularly to identify high-win-rate setups and backtest your strategy on historical data. This will help refine your approach and ensure effectiveness in various market conditions.
Advanced Candlestick Patterns for Precision
Now we will focus on the 7 most common patterns: Doji, Hammer, Shooting Star, Hanging Man, Bullish/Bearish Engulfing, and Piercing Line.
We’ll explain how each pattern forms and its psychological drivers, along with specific trading setups and price levels. Get ready to use candlestick patterns as a guide for successful forex trading!
1. Doji: The Market’s Crossroads
Formation: A Doji is a moment of market suspense, where the open and close prices are nearly identical, creating a tiny body with wicks that can vary, short for a standard Doji, long for a Long-Legged Doji, or one-sided for Dragonfly/Gravestone Doji. It’s like a pause in a high-stakes chess game, often appearing after sharp trends or at key levels like support or resistance.
Psychology: Picture traders frozen in a standoff, buyers and sellers locked in a tug-of-war, neither gaining ground. A Doji signals indecision, hinting that the market is teetering on the edge of a reversal or breakout. On EUR/USD, a Doji after a rally might mean bulls are catching their breath, giving bears a chance to pounce.
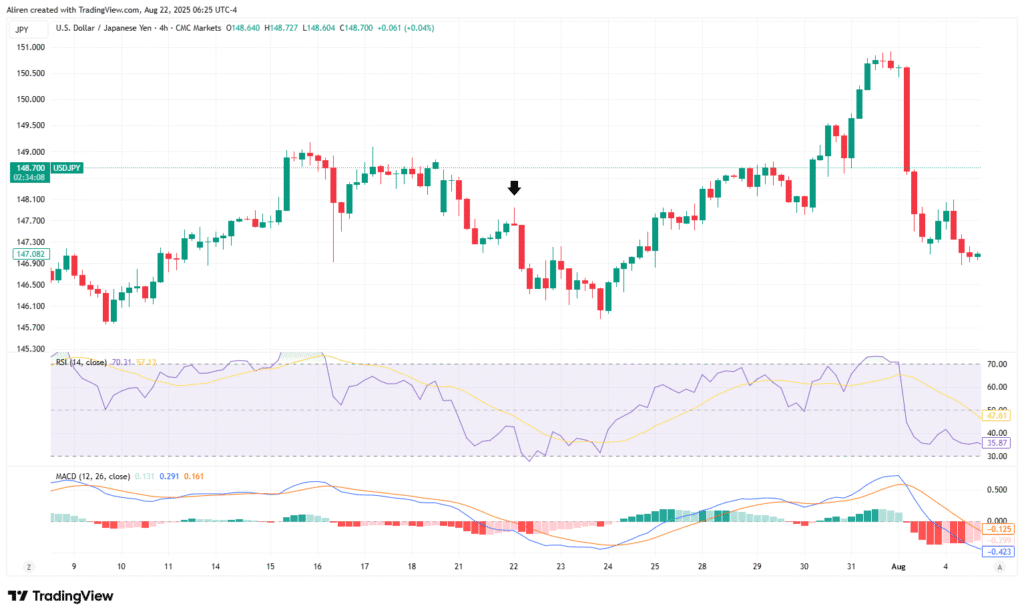
Trading Application: In the chart above, the specified candlestick is a red Doji with a long upper shadow and no lower shadow, sometimes called an Inverted Hammer or Gravestone Doji. It appears in a downtrend, showing that sellers initially pushed prices down while buyers tried to take control but failed, leading to a close near the opening level.
This Doji often indicates indecision or a pause, but in this case, the market continued downward with two more bearish candles. A trader might have waited for these candles to confirm the direction before acting. For instance, they could have initiated a short trade after the next bearish candle and placed a stop-loss above the Doji’s high to manage risk. This highlights the need to wait for confirmation when trading Doji candlesticks, as they don’t guarantee a reversal or continuation.
2. Hammer: The Bullish Battle Cry
Formation: A Hammer is a bullish warrior, appearing at a downtrend’s bottom with a small body (open/close near the top) and a long lower wick (at least twice the body’s length), often with a tiny or no upper wick. It’s like a sword planted in the ground, marking the moment buyers defend a key level.
Psychology: A long lower wick shows that sellers pushed prices down, but intense buying pressure brought them back up, like bargain-hunters entering at a EUR/USD support level. This suggests a possible reversal as buyers regain control, driven by hope or changes in the market.
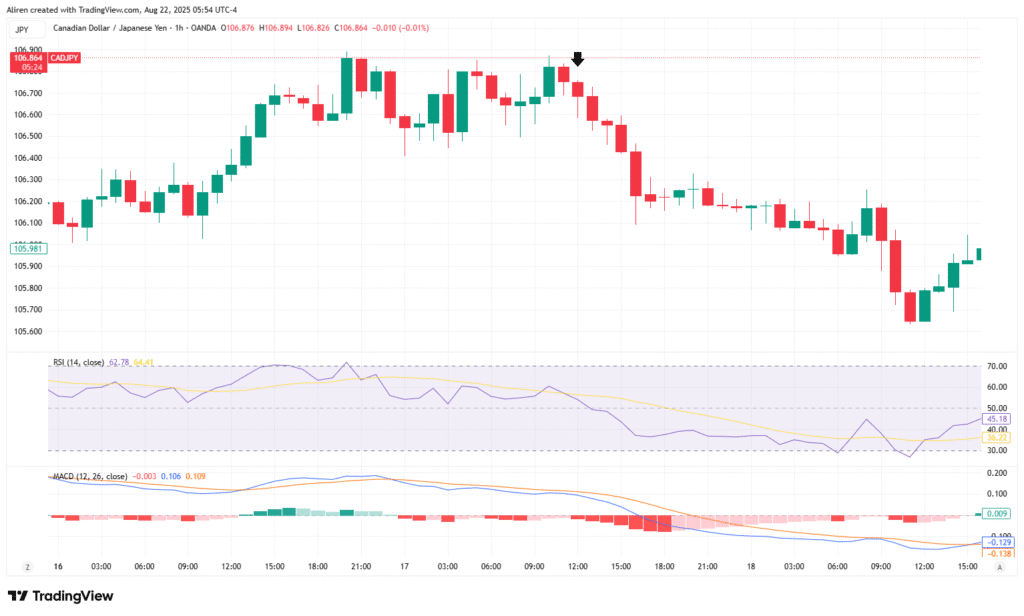
Trading Application: The candlestick shown in the chart resembles a Hammer Candlestick Pattern, which typically suggests a potential reversal after a downtrend. However, in this case, the market continued to decline instead of reversing. The Hammer’s long lower shadow indicated selling pressure followed by buyer support, but the lack of a confirmation candle (a bullish close above the Hammer’s high) invalidated the reversal signal. Traders could have expected the downtrend to continue and entered a short position below the Hammer’s low (around 106.570), setting a stop-loss above its high (106.744) to manage risk. This highlights the importance of waiting for confirmation before trusting reversal patterns like the Hammer.
3. Shooting Star: The Bearish Comet
Formation: A Shooting Star blazes across an uptrend’s peak, with a small body (open/close near the bottom) and a long upper wick (twice the body’s length), often with minimal lower wick. It’s like a comet burning out, signaling the end of a bullish run.
Psychology: The long upper wick captures buyers pushing prices to new highs, only to be slammed back by sellers—profit-takers or bears smelling overextension. This rejection at resistance hints at a bearish reversal, especially in overheated markets.
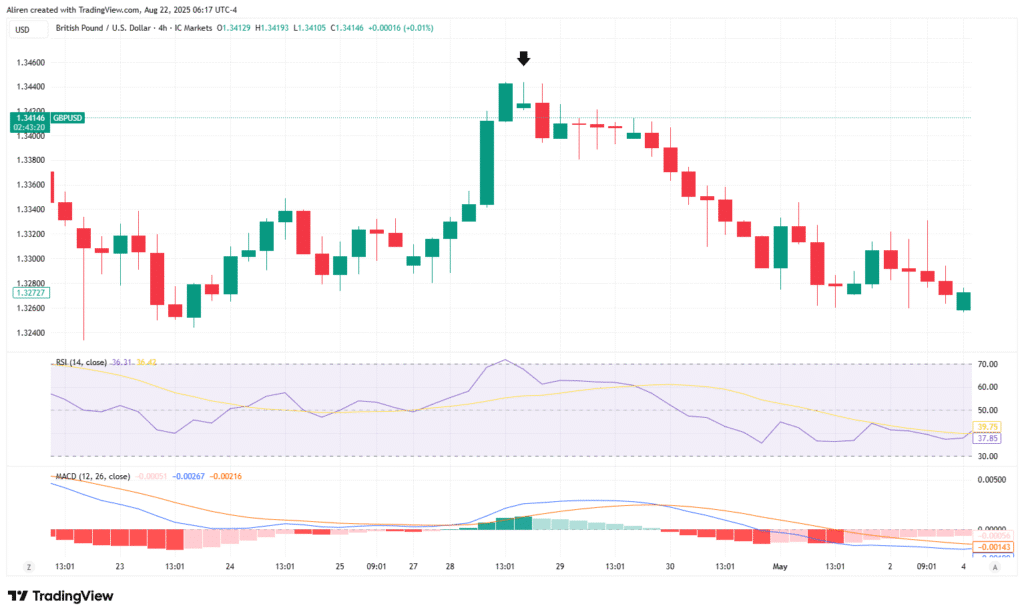
Trading Application: In the chart above, the Shooting Star candlestick showed up at the top of an uptrend, suggesting a possible bearish reversal. After it formed, the next candlestick confirmed the reversal with a strong bearish close. A trader could have opened a short position below the low of the Shooting Star (around 1.3398) and placed a stop-loss above its high (around 1.3429) to manage risk. The take-profit target could be set near the next support level (around 1.3298), which aligns with the SMA line and the downward momentum indicated by the MACD crossover and the RSI falling from overbought levels. This setup would have allowed the trader to take advantage of the following downtrend.
4. Hanging Man: The Bullish Bubble Burst
Formation: A Hanging Man dangles precariously at an uptrend’s top, with a small body (open/close near the top) and a long lower wick (twice the body’s length). It’s like a warning flare, showing buyers struggling to hold gains.
Psychology: The long lower wick reveals sellers testing lower prices, with buyers barely recovering the close—a sign of weakening bullish conviction. This signals a potential reversal as profit-taking or bearish sentiment takes hold.
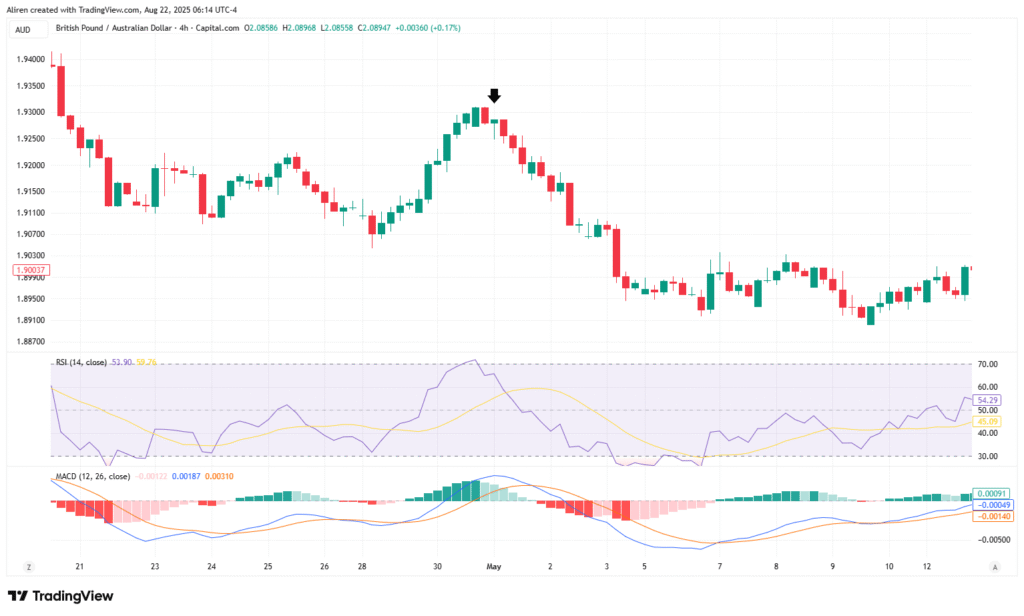
Trading Application: In the chart above, the circled candlestick is a Hanging Man, which appeared after a strong uptrend on the GBP/AUD 4-hour timeframe. Following this candlestick, the next candle closed bearish, confirming the potential reversal. A trader could have entered a short position below the low of the Hanging Man, with a stop-loss placed above its high to manage risk effectively. The subsequent price action shows a clear downtrend, validating the Hanging Man as a signal for the exhaustion of buying pressure and the start of bearish momentum. This setup emphasizes the importance of confirmation and proper risk management when trading reversal patterns.
5. Bullish Engulfing: The Bullish Tsunami
Formation: A Bullish Engulfing is a tidal wave of buying power, with a small red candle swallowed by a larger green candle (open below the red candle’s close, close above its open). It forms at a downtrend’s end, signaling a dramatic shift.
Psychology: This pattern is a bullish uprising—sellers dominate the first candle, but buyers storm in, overwhelming them with aggressive buying. It’s like a dam breaking at a key support, driven by optimism or news catalysts (e.g., ECB rate cut for EUR/GBP).
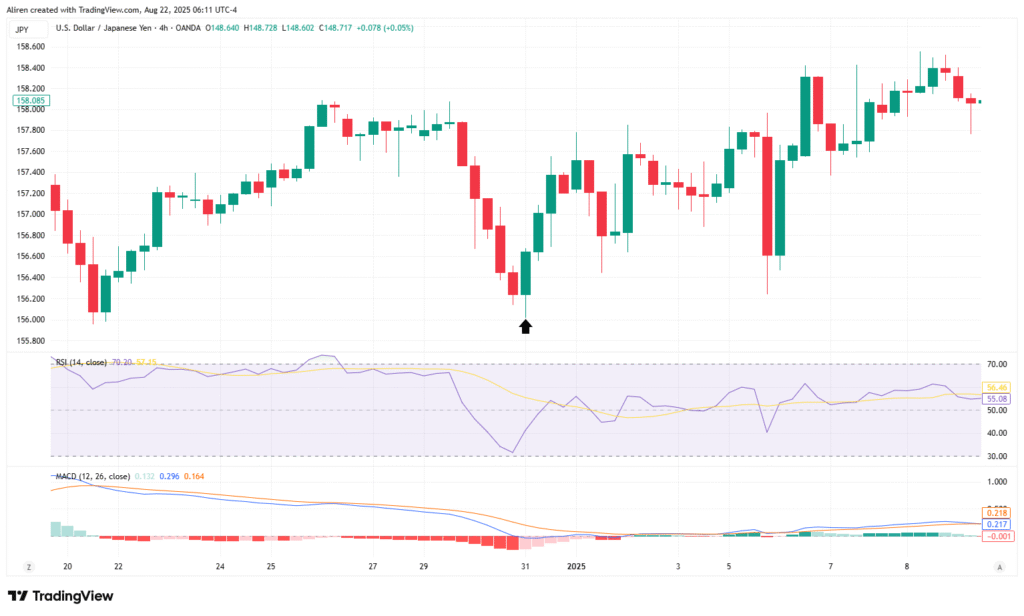
Trading Application: In the chart above, the circled area highlights a Bullish Engulfing Pattern, which occurred after a short-term downtrend on the USD/JPY 4-hour timeframe. The second candlestick (green) completely engulfs the body of the previous bearish candlestick (red), signaling a potential reversal to the upside. Traders could have entered a long position after the close of the engulfing candle to confirm the bullish momentum. A stop-loss could be placed below the low of the engulfing pattern (around 155.800) to manage risk. At the same time, the take-profit target could align with the next resistance level or be based on a favorable risk-reward ratio, such as 2:1. The confirmation of the reversal is supported by the RSI moving away from oversold levels and the MACD showing early signs of bullish momentum, making this a valid setup for a long trade.
6. Bearish Engulfing: The Seller’s Avalanche
Formation: A Bearish Engulfing is a seller’s onslaught, with a small green candle engulfed by a larger red candle (open above the green candle’s close, close below its open). It forms at an uptrend’s peak, signaling a reversal.
Psychology: The chart above shows a Bearish Engulfing candlestick pattern, which appeared after a short-term uptrend on the GBP/JPY 15-minute chart. This pattern signals a potential price reversal, as the large red candle covers the smaller green candle, indicating a shift from buying to selling pressure.
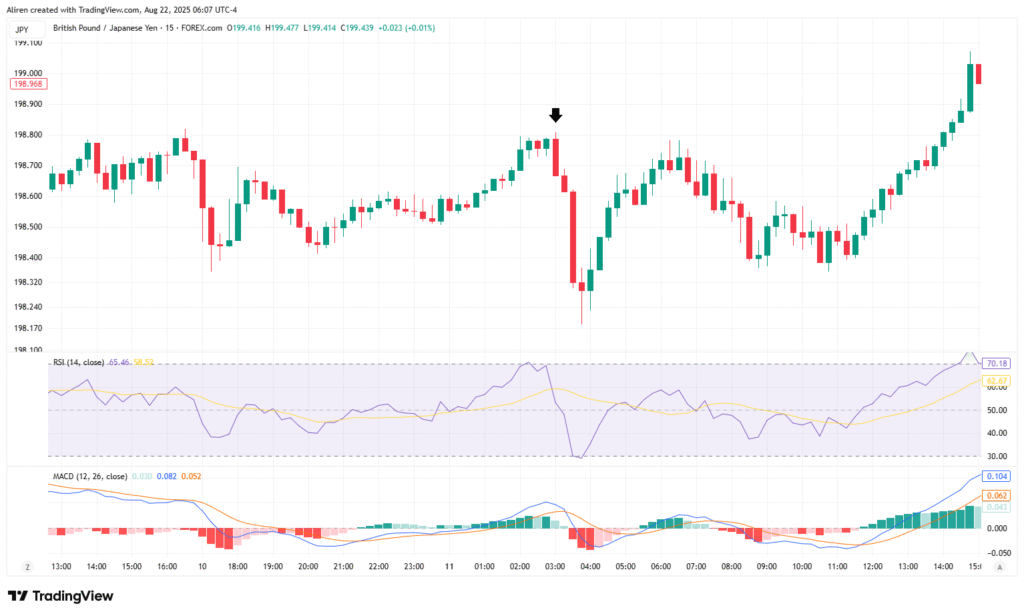
A trader could enter a short position below the low of the engulfing candle and place a stop-loss above its high. The substantial drop that followed confirmed the signal, allowing the trader to target the next support level. This situation highlights the importance of recognizing candlestick patterns in the trend and using proper risk management.
7. Piercing Line: The Bullish Comeback
Formation: A Piercing Line is a bullish counterattack, with a red candle followed by a green candle that opens lower but closes above the first’s midpoint. It forms at a downtrend’s bottom, signaling a partial reversal.
Psychology: The green candle’s strong close shows buyers rejecting a lower open, like bargain-hunters diving in at an AUD/JPY support. This reflects a surge in bullish confidence, often triggered by technical or fundamental support.
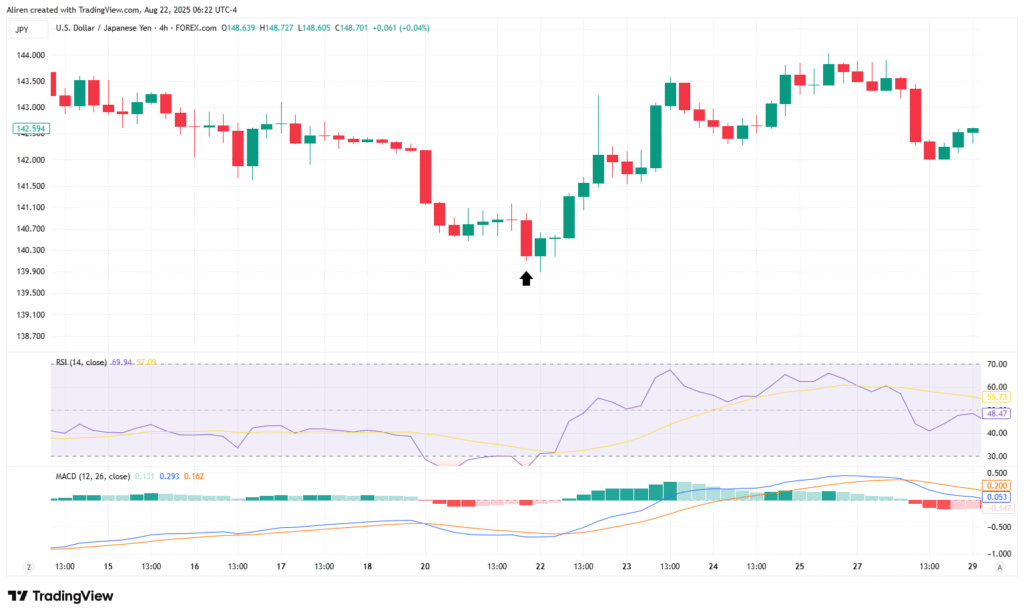
Trading Application: In the chart above, the Piercing Line Pattern is circled. This pattern formed after a strong bearish candle and suggests a possible price reversal upward. The second candlestick (green) opened below the previous candle’s close and closed above its midpoint, showing that buyers took control. Traders could enter a long position after the piercing candle closed (around 148.600) to confirm bullish momentum. To manage risk, a stop-loss could be set below the low of the pattern (around 148.200), while the take-profit target could match the next resistance level (around 149.500) or follow a suitable risk-reward ratio. This setup emphasizes the need for confirmation and good positioning when trading reversal patterns.
Avoiding Common Pitfalls in Candlestick Trading
Candlestick patterns guide you through the forex market, but a misstep can turn their signals into traps. Mastering them means avoiding pitfalls that even experienced traders face. Think of yourself as a navigator in a storm—avoid mistakes, and you’ll find profits; falter, and you risk getting lost.
Overtrading Patterns:
Chasing candlestick patterns without context can lead to disaster. Trading them indiscriminately, especially in volatile markets, results in false signals and depleted accounts.
Trading in Low-Volatility Conditions:
Trading during quiet market hours, when there’s little momentum, can lead to patterns fizzling out. Low liquidity can result in misleading candlesticks and weak follow-through.
Ignoring Higher Timeframes:
Focusing solely on short-term charts risks missing the market’s bigger picture. A pattern may look promising in isolation, but if it contradicts the broader trend on higher timeframes, it’s likely just noise, leading to misguided trades.
Trading Unconfirmed Patterns:
Relying on a candlestick pattern alone, without supporting signals from volume or technical indicators like RSI or MACD, is like shooting an arrow blindfolded. Unconfirmed patterns are prone to failure, turning potential wins into losses.
Conclusion:
You’ve learned about candlestick trading and how to read market emotions through patterns like Doji, Hammer, and Piercing Line. These patterns are your advantage in forex trading, revealing tales of greed, fear, or uncertainty.
By using our 7 key patterns alongside trends and indicators like RSI and Fibonacci, you can outsmart other traders and generate steady profits. Avoid mistakes like overtrading and using unconfirmed signals; trade only when the market aligns with your plan.
Practice on demo accounts and improve your skills with each trade. With candlestick knowledge, you can take control of the charts, spot the next Bullish Engulfing or Shooting Star, and make your moves!