

Dear Traders,
We’re excited to bring you a new update packed with unique features and improvements.—a completely revamped dashboard filled with advanced analytics and insightful charts. These new features are designed to significantly enhance your trading experience and help you achieve better performance. Read on to discover how you can leverage these tools to elevate your trading strategies.
Overview Tab: Your Essential Metrics at a Glance
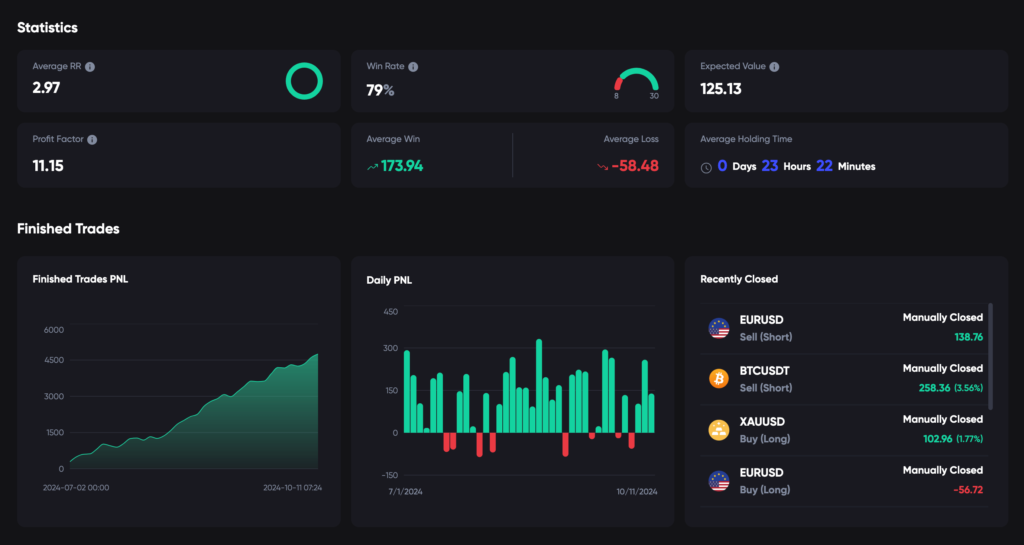
The Overview section provides immediate access to the most important metrics you need to track:
- Risk-Reward Ratio (RR): Understand the balance between your potential profit and loss.
- Profit Factor: Measure the efficiency of your trading strategy.
- Win Rate: Keep tabs on your trading success percentage.
- PNL Chart: Visualize your profit and loss over time.
- Daily PNL: Monitor your daily trading performance.
- Recently Closed Trades: Quickly review the outcomes of your latest trades.
How this helps you: By having all key metrics in one place, you can easily identify patterns, assess your performance, and make informed decisions to enhance your trading strategy.
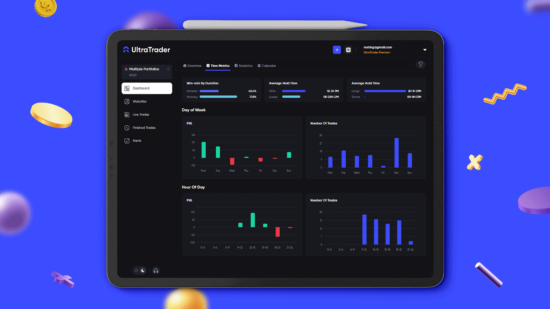
Time Metrics Tab: Dive Deep into Time-Based Performance
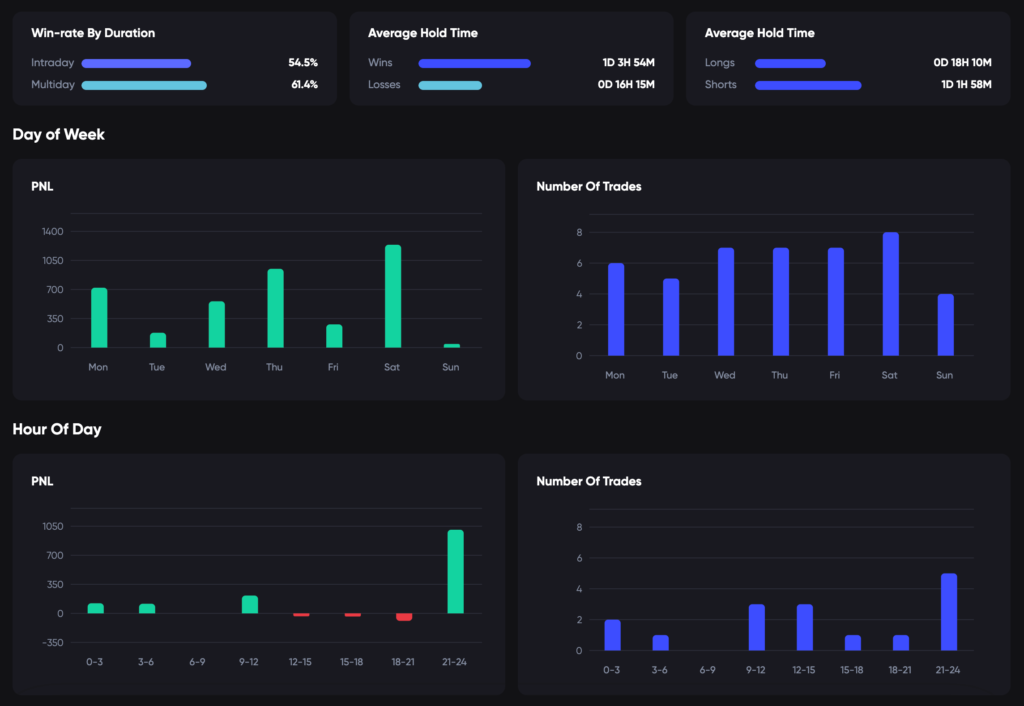
The Time Metrics tab offers insights into how time factors affect your trades:
- Win Rate by Trade Duration: Discover how the length of your trades influences success.
- Average Hold Time of Longs vs. Shorts: Compare your holding periods for long and short positions.
- Average Hold Time of Winners vs. Losers: Analyze the duration differences between profitable and losing trades.
- Performance by Day of Week and Hour of the Day: Identify the most profitable times to trade.
How this helps you: Understanding time-related metrics allows you to optimize your trading schedule and strategies based on when you’re most successful.
Analytics Tab: Uncover Your Best and Worst Performers
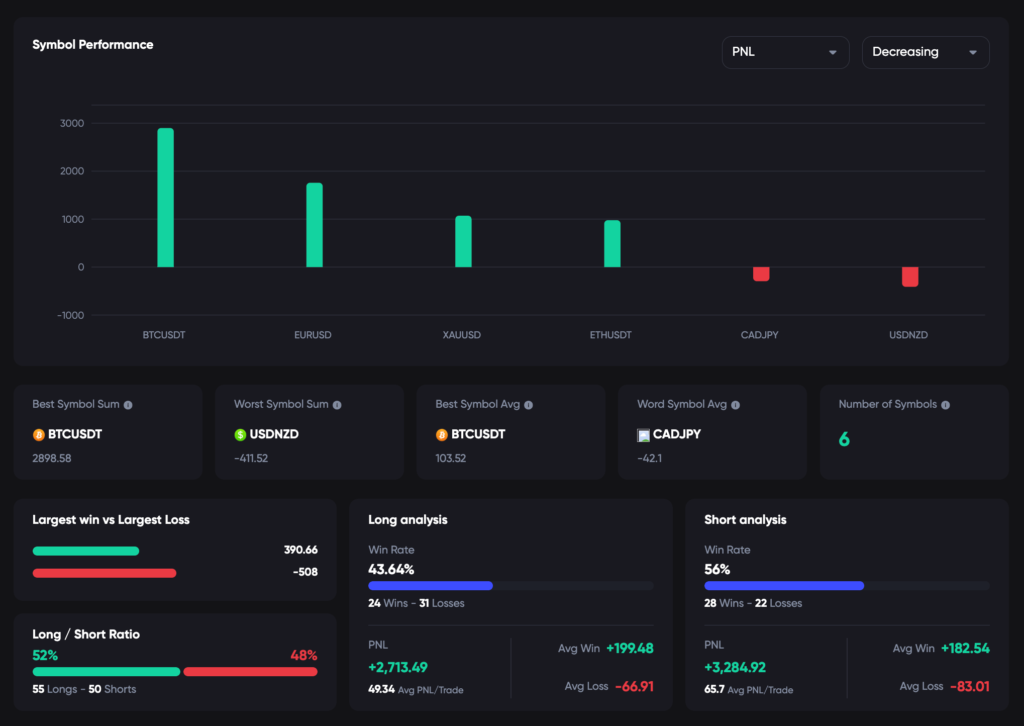
The Analytics tab provides a detailed look at:
- Best and Worst Performing Symbols: Based on PNL, win rate, and the number of trades.
- Long vs. Short Performance Stats: Evaluate which positions yield better results for you.
How this helps you: By identifying which symbols and positions perform best or need improvement, you can focus your efforts more effectively and adjust your strategies accordingly.
Calendar Tab: Enhanced Visuals for Better Tracking
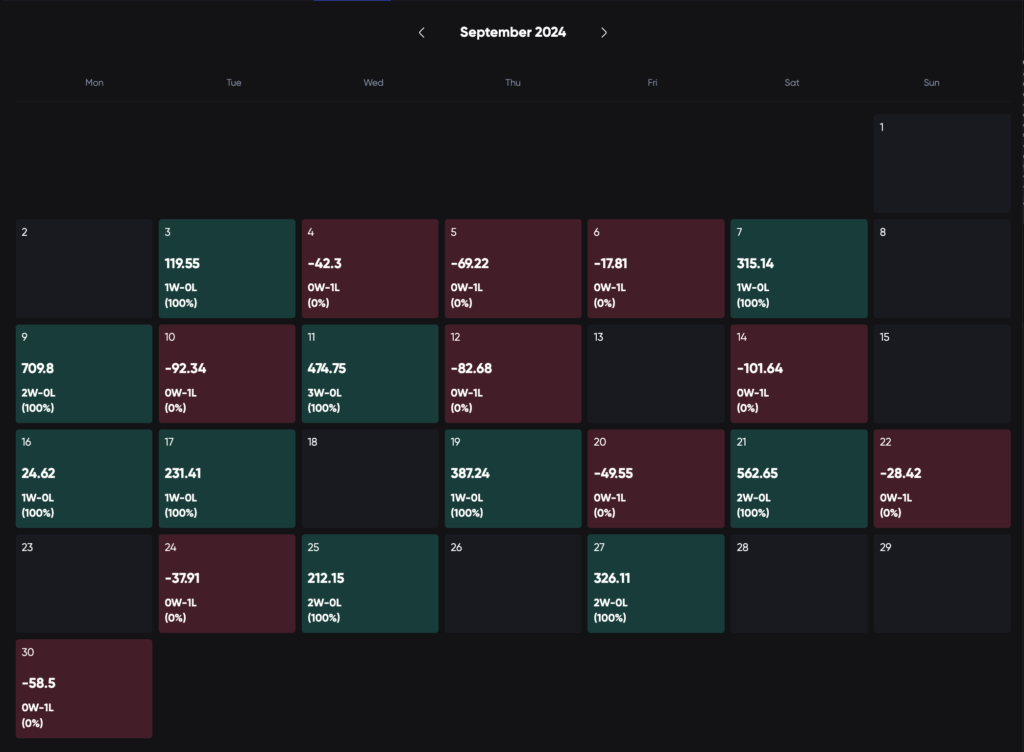
We’ve moved the Calendar tab to the dashboard and given it a fresh redesign:
- Larger Display Area: Easier viewing of your trading activity over time.
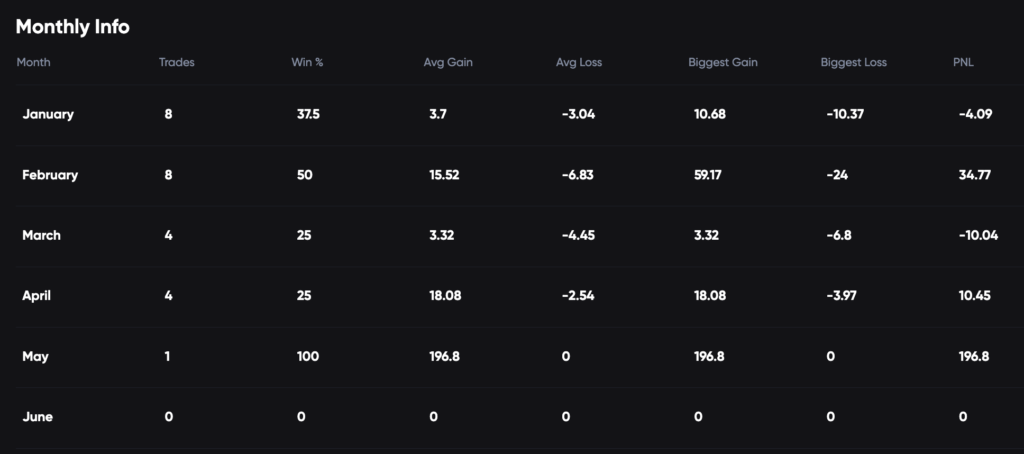
- Detailed Monthly and Weekly Stats Table: Get comprehensive monthly and weekly stats to closely monitor your performance.
How this helps you: The enhanced calendar allows for better tracking of your trading history, helping you spot trends and make data-driven decisions.
Advanced Filtering: Customize Your View
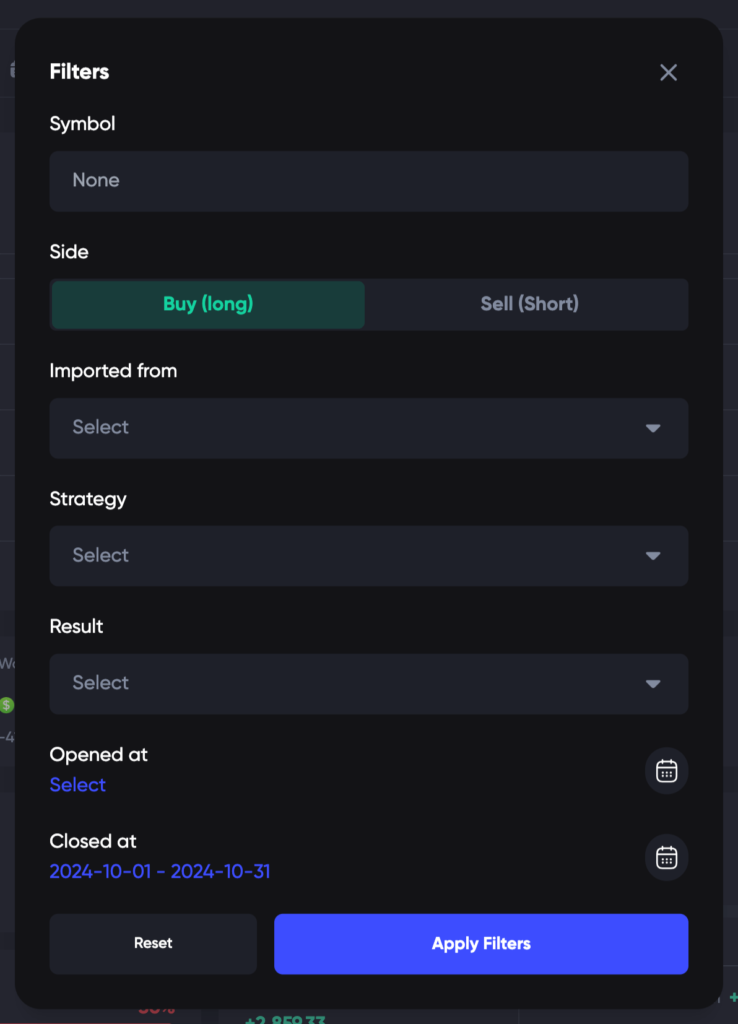
The dashboard now features a filter in the top right corner, enabling you to tailor your analytics:
- Duration: View performance for any time frame.
- Symbol: Focus on specific assets.
- Side: Analyze long or short positions.
- And More: Customize your dashboard to suit your trading preferences.
How this helps you: Advanced filtering lets you hone in on specific data, providing clearer insights to fine-tune your trading strategies.
We’re confident these new features will significantly aid your trading journey. Explore the revamped dashboard in your trading journal today and take advantage of the enhanced analytics to boost your performance.
Happy Trading!