


Gold Powers Higher On Safe Haven Flows And Fed Easing Expectations
Gold continued its strong momentum this week, pushing into uncharted territory. The metal decisively broke above $3,900, at one point brushing $4,000, as global uncertainty and growing bets on U.S. rate cuts drove demand. The breakout felt not just technical, but psychological: crossing the $4,000 barrier added fresh conviction to the bullish thesis.
Underlying Drivers & Market Dynamics
- Safe haven demand returned in force — geopolitical jitters, trade tensions, and economic fragility pushed investors toward perceived safe assets.
- The market increasingly priced in two 25-bps rate cuts by the Fed later this year, softening the U.S. yield environment and reducing opportunity cost for holding non-yielding gold.
- Central bank purchases and ETF inflows also added structural support, amplifying momentum once the price broke key resistance zones.
- On the flip side, softer U.S. data (inflation, consumption) hinted at a more dovish Fed path, which bolstered the bullish gold narrative.
Technical Outlook
Gold’s chart now shows a strong upward trajectory. The key breakout zone around $3,900 shifts into support. Below that, a secondary support band sits between $3,850–$3,900. Above, $4,000 is now the psychological battleground; if bulls can sustain gains above it, the next leg could target $4,050–$4,150. However, extended overbought conditions could invite short-term pullbacks or rotational losses.
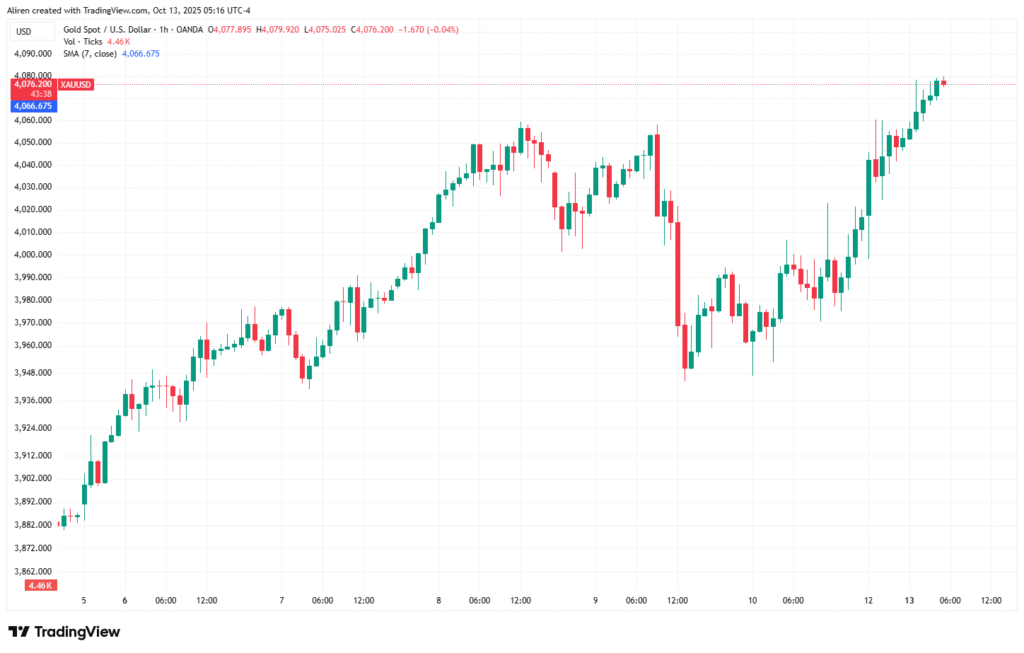
A corrective scenario would likely test the 20- or 50-day moving averages as intermediate support, possibly near $3,800.
U.S. Dollar Index (DXY) Falters Amid Shifting Policy Expectations
The DXY had a turbulent week. It started with tentative strength but gradually surrendered ground as dovish tilts in Fed messaging and soft macro data nudged the dollar lower. By week’s end, the index was battling downside pressure, illustrating the tug-of-war between yield expectations and risk flows.
Key Observations & Catalysts
- A cooling tone from Fed speakers and weaker-than-expected inflation prints loosened the dollar’s grip.
- Trade rhetoric with China wavered between hawkish and conciliatory, adding volatility to currency flows.
- As gold (and other alternatives) gained, some capital likely rotated out of dollar holdings — magnifying the weakness.
Technical Outlook
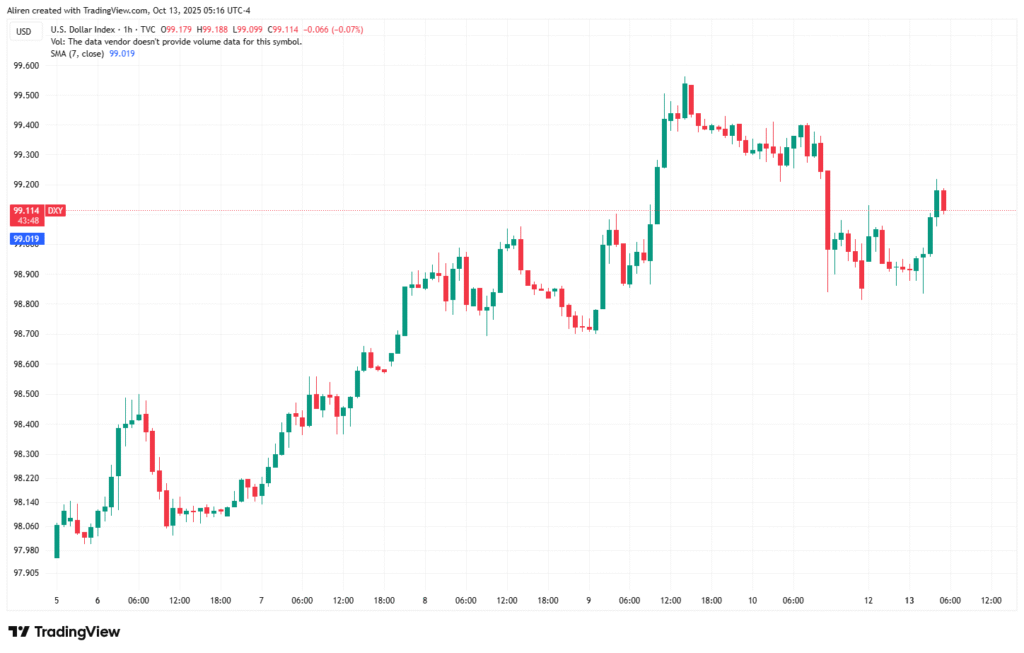
Short-term support lies near 98.8–98.5 (recent swing lows). If that breaks, DXY could gravitate toward 98.0. On the upside, resistance clusters at 99.5–100.0. Until the dollar reclaims the upper resistance band, the broader bias leans mildly bearish. Persistence above 100 would be needed to validate a reversal in trend.
Bitcoin: A Sudden Plunge, Followed By Tentative Stabilization
Crypto was the wild card this week. Bitcoin began with momentum but suffered a steep drop mid-week, triggered by forced liquidations and macro headwinds. That said, it found buying interest near support zones and ended the week attempting a modest recovery.
Market Mechanics & Risk Events
- The cascade of leveraged liquidations — particularly long positions — drove a sharp descent. This was exacerbated by stop-loss triggers and tightening risk-premium across derivatives markets.
- The sudden U.S.–China tariff escalation injected fresh uncertainty, tightening global financial conditions and spooking risk assets, including crypto.
- By late in the week, selective accumulation and technical rebounds helped BTC regain part of the loss, though volatility remained elevated.
Technical Outlook & Levels To Watch
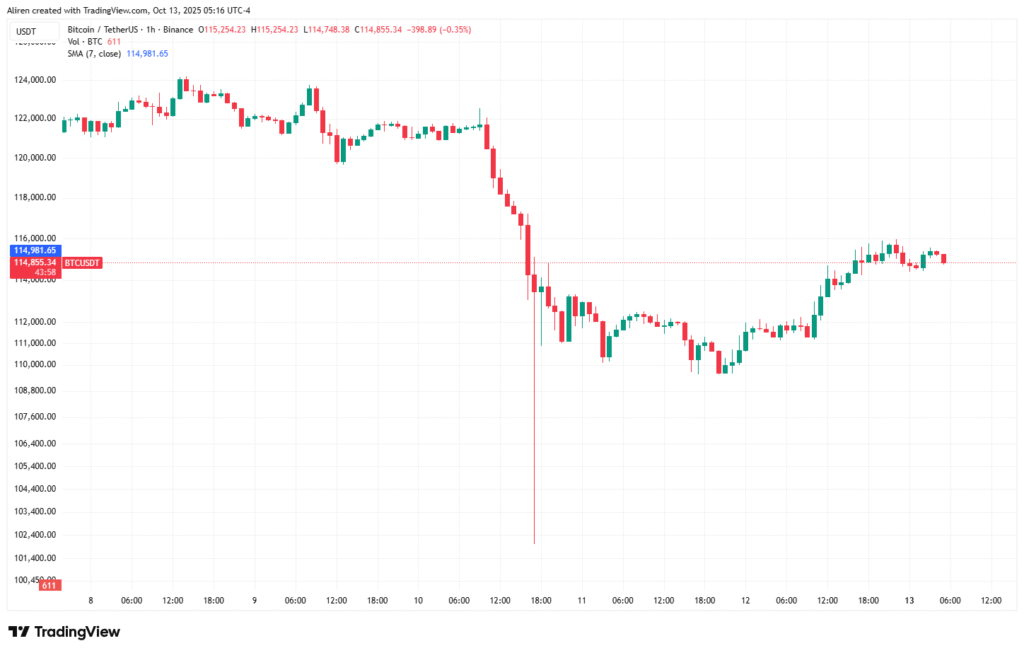
Bitcoin’s immediate support resides in the $110,000 – $107,000 zone (weekend lows). Resistance presents itself at $118K–$120K, a region that may absorb heavy supply from those seeking to exit positions.
If BTC can close decisively above $120K, it could reset the short-term structure toward higher targets (e.g. $125K+). But if support fractures, deeper retracements – possibly toward $105K or lower – could unwind traders’ positioning.
Sentiment indicators and on-chain metrics will be critical in watching whether this rebound is sustainable or just a bounce in a wider down-phase.
Ethereum: Mirrors The Fall, Then Fights Back Toward $4,100
Ethereum followed in BTC’s footsteps — downside early in the week, then bid support near critical levels. The slide under $4,000 shook out weaker positioners, but ETH managed to claw back ground as the week progressed, attempting to reassert strength.
Structural Developments & Flow Insights
- Derivative markets saw open interest shrink, indicating deleveraging across the board. ETH’s move was less dramatic than BTC’s, partly due to less speculation in ultra-levered positions.
- Institutional and ETF flows remain a tailwind; Citi, for example, raised its year-end ETH forecasts, citing inflows from digital-asset treasuries and ETF demand.
- Some analysts remain bullish, projecting ETH could rally toward $5,000+ if macro conditions support it and structural demand holds.
Technical Outlook
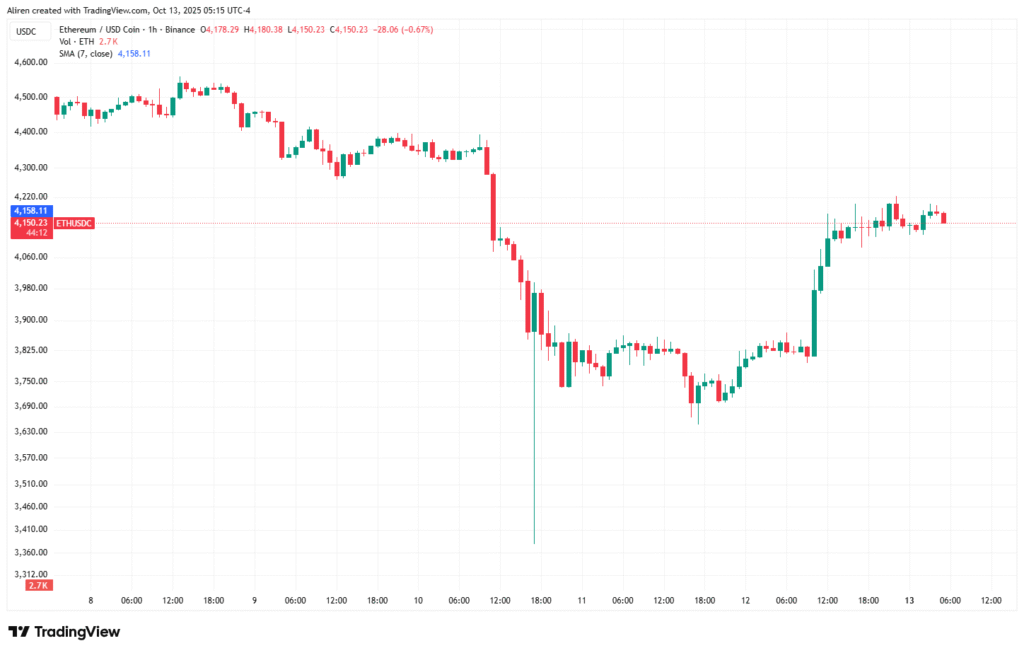
Short-term resistance zones lie around $4,100–$4,150. Clearance above that could open $4,300 or $4,400 tests.
On the downside, $3,900–$3,800 is the first defensive line; a break there could slide ETH toward lower swing supports (e.g., $3,600–$3,700).
Medium-term, ETH might yet test $5,000, but that path likely requires sustained macro tailwinds, institutional accumulation, and a favorable yield environment.
Weekly Market Wrap-Up & What to Watch
This was a notable week of divergence and structural resets. Gold surged to new highs under safe-haven demand and prospects of Fed easing. Meanwhile, the U.S. dollar softened amid shifting expectations. In contrast, crypto endured intense volatility — Bitcoin and Ethereum both plunged on forced deleveraging and macro shocks, though they managed to claw back part of the losses into the week’s end.

Start Journaling Today

Start Journaling Today
Key point: Volatility is back in force. Short-term traders may find choppy intraday windows; long-term holders will want to monitor whether structural levels hold.
What To Watch Next
- U.S. inflation and jobs reports — they may recalibrate Fed timing and tilt market sentiment.
- Policy speeches from Fed officials for cues on rate path.
- Continued flows into gold and digital assets (ETF and institutional).
- On-chain metrics and derivatives positioning in crypto for signs of capitulation or renewed accumulation.
Levels To Keep An Eye On:
- Gold: support ~ $3,900 / resistance ~ $4,000+
- DXY: support ~ 98.5 / resistance ~ 100
- BTC: support ~ $110K / resistance ~ $120K
- ETH: support ~ $3,900 / resistance ~ $4,100+