


Gold (XAU)
Gold Futures Surge Past $3,500 After US Tariffs Target Bullion; Spot Holds Near $3,400
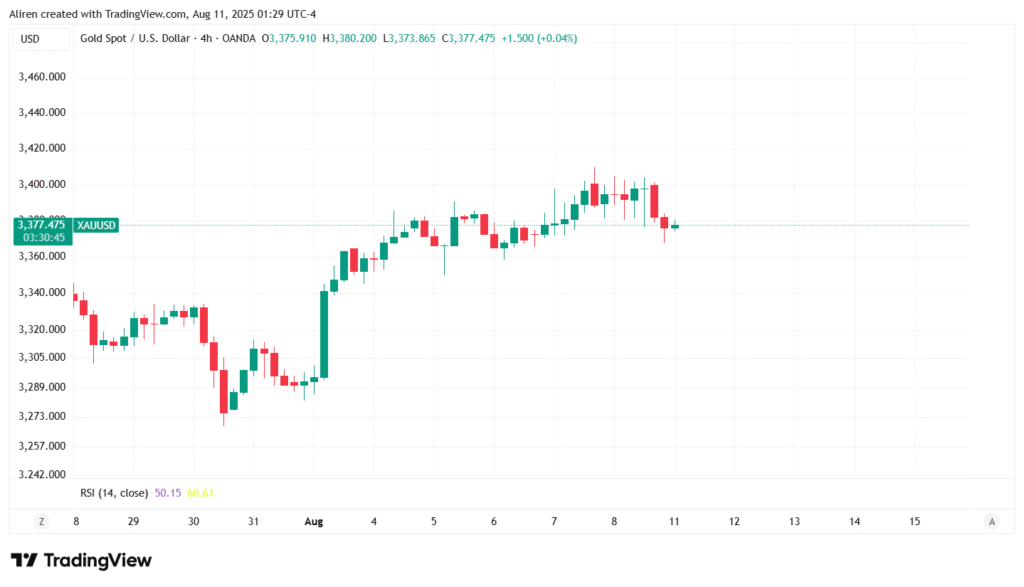
Gold price is stable in the spot markets, but futures hit a record high of $3,534 after reports that the United States will impose tariffs on gold bar imports. Traders are also analyzing US economic data from the past week as they prepare for inflation figures coming out next week. The XAU/USD is trading at $3,397, showing little change.
During the overnight session, the price difference between New York Comex futures and spot prices increased by more than $100. Reuters reported this after the Financial Times said on Thursday that the US had imposed tariffs on one-kilo gold bars, based on a letter from US Customs and Border Protection.
Despite this, spot prices for XAU/USD remain around the $3,400 level, as investors believe the Federal Reserve will cut rates by 25 basis points at its meeting in September.
Technical Outlook:
Gold price moves sideways, hovers around $3,400
Gold price is consolidating between $3,380 and $3,400, with the RSI remaining bullish yet flat. If XAU/USD surpasses $3,400, the following targets are the June 16 peak at $3,452 and the record high of $3,500. If prices weaken, gold may test the 50-day and 20-day SMAs between $3,355 and $3,348, with potential support at the 100-day SMA around $3,279 if it falls below $3,300.
US Inflation In Focus Next Week: CPI, PPI, and UoM Inflation Expectations
In the coming week, the outlook for gold will be scrutinized with the release of US inflation and retail sales data. The Consumer Price Index (CPI) is set for Tuesday, followed by the Producer Price Index (PPI) on Thursday. On Friday, key indicators will include the University of Michigan’s Inflation Expectations survey, consumer sentiment, retail sales, and industrial production figures.
The Fed aims for price stability around a 2% inflation target, but concerns are growing about future inflation, partly due to the impact of Trump’s tariffs. So far, CPI has fallen short of forecasts for five months, raising the question of whether that trend might change.
The PPI report is crucial, as it influences the Fed’s preferred inflation measure, the core PCE index, due later this month. Friday’s retail sales data will be closely watched, as weak consumer spending combined with rising inflation could heighten fears of stagflation.
Read how to use Economic Indicators in UltraTrader’s blog.
US Dollars (DXY)
US Dollar Manages to Ignore the Strengthening of Doves in the Fed
Labour market statistics shifted market sentiment last week and halted the US dollar’s rise. Modest employment growth in July and a revision showing 258,000 fewer jobs in May and June made investors believe the economy is cooling. Derivatives raised the chances of the Federal Reserve easing monetary policy in September from 20% to 90%, reducing the dollar index by 2%.
President Trump fired the head of the Bureau of Labour Statistics for allegedly falsifying data, adding to the US dollar’s struggles against major currencies. Trump nominated his economic adviser, Stephen Miran, to the Fed for a temporary position until January 31, 2026. If approved, he could be the top candidate for Fed chairman, supporting lower interest rates.
Jerome Powell’s term ends in May 2026, but rumors about his early resignation persist. Bloomberg recently named Christopher Waller as a leading candidate for Fed chairman, but that was before Miran’s nomination. In this situation, investors are seeking a higher risk premium from US assets.
Technical Outlook:
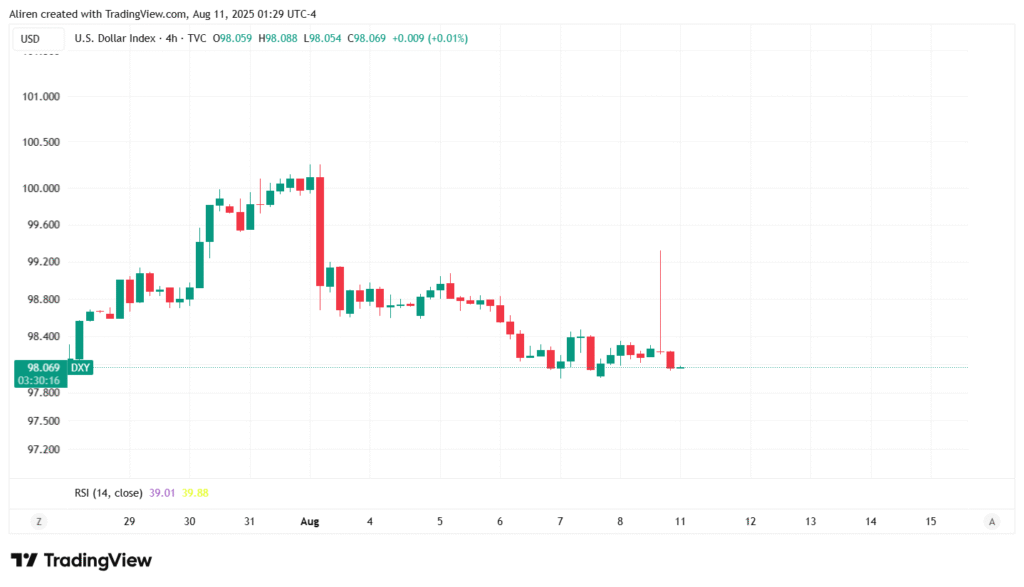
The dollar index is testing the 50-day moving average again. However, this time it acts as support, although it has been acting as resistance since February. From April to June, the RSI on weekly timeframes was oversold, and now it has recovered, which is often followed by a rebound.
It would not be surprising if the DXY continues to swim against the tide, adding a couple of percent next week to the 100 area from the current 98. Further growth will be a serious victory for the bulls if the fundamental background remains bearish.
Crypto Market Overview
Bitcoin (BTC)
BTC Bulls Target $120,000 as Trump Moves to Allow Crypto in 401(k) Plans
Bitcoin (BTC) looks set to close the week in the green, breaking above the $116,000 resistance, as market optimism swelled after United States President Donald Trump signed an executive order to include alternative assets, including crypto, in US 401(k) retirement accounts.
Adding to this, Japan’s SBI Holdings made headlines by filing for a dual-asset crypto ETF, which, if approved, would provide more exposure to both BTC and XRP.
Trump’s 401(k) Crypto Plan Boosts Bitcoin Price.
Bitcoin began the week positively, recovering slightly from last week’s drop. The price increased on Thursday when US President Donald Trump signed an executive order allowing cryptocurrencies, private equity, and real estate in 401(k) plans, helping Bitcoin close above $116,000.
Some critics worry this could create instability in retirement accounts, and details of the order are not yet precise. The order permits retirement plans to include digital assets, precious metals like gold, and private loans alongside traditional stocks and bonds.
The demand for stablecoins from China is also boosting the crypto market. China plans to launch stablecoins to promote its currency, the Renminbi (CNY), and reduce reliance on the US dollar. Hong Kong will serve as the testing ground for these new regulations, as the industry is banned on the mainland.
The push for stablecoins follows Trump’s introduction of the GENIUS Act for stablecoin regulation. This growing demand from major economies offers a positive outlook for Bitcoin and other cryptocurrencies, as stablecoins can serve as an entry point into the cryptocurrency market.
US Trade Tariffs Came Into Effect
Donald Trump’s fresh tariff threats this week keep investors on edge and add a fresh layer of risk, introducing volatility across crypto markets.
Trump imposed additional levies on Indian imports as “punishment” for buying oil from Russia, taking the total tariffs to 50%. Trump had also announced this week that tariffs on semiconductors and pharmaceuticals will be imposed within the next week or so.
Will BTC Hit a New All-Time High?
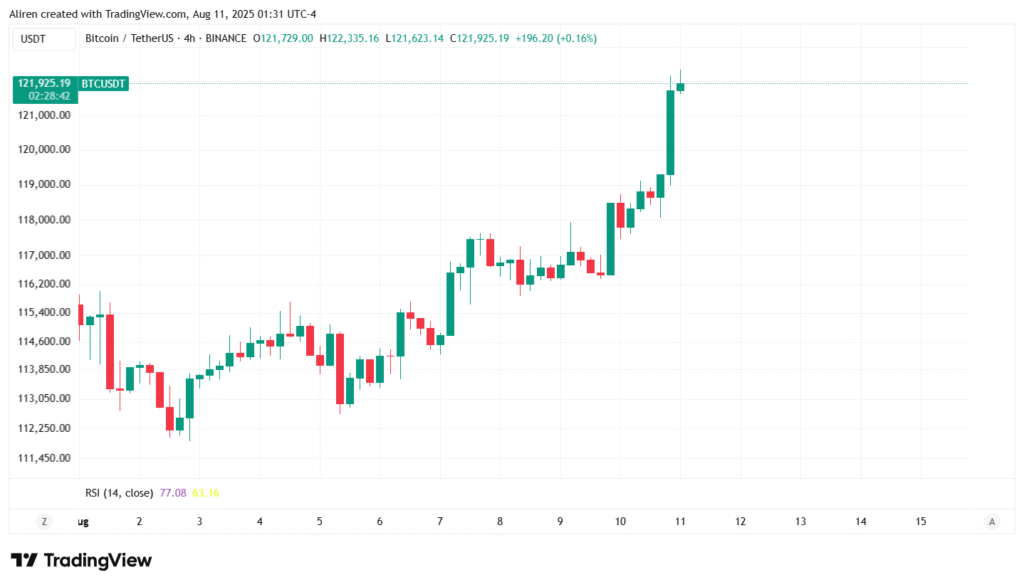
Bitcoin closed above $116,000 on Thursday and is now around $118,000. If $116,000 holds as support, BTC could rise toward $120,000. A close above this level could push it to its all-time high of $123,218 from July 14.
The Relative Strength Index (RSI) is currently at 54, showing that bearish momentum is fading. To maintain the bullish trend, the RSI needs to keep rising. The Moving Average Convergence Divergence (MACD) lines are getting closer, and decreasing selling pressure is noted.
If BTC fails to support at $116,000 and closes below it, the price might fall to $113,422.
Ethereum (ETH)
ETH Surges Above $4,000, Fueled by Demand From Treasury Companies
Ethereum (ETH) regained the $4,000 mark on Friday. This rise follows strong interest from public companies that are using it as a key asset in their finances.
Demand from Ethereum treasury companies pushes ETH past $4,000
Ethereum recently surpassed $4,000 for the first time in eight months, according to Binance data. After starting the year with a 65% decline from $4,107 to $1,385, ETH has now increased over 180% since hitting that low, rising more than 60% in the last month.
This growth is mainly due to companies investing in ETH. Since June, firms like BitMine Immersion and SharpLink Gaming have bought nearly 2 million ETH using funds from debt and equity offerings.
Geoffrey Kendrick from Standard Chartered noted that these companies could own 10% of ETH’s total supply and are currently better investments than US spot ETH exchange-traded funds (ETFs), which have seen continuous inflows. In July alone, ETFs attracted over $5 billion.
Additionally, the SEC recently stated that liquid staking of crypto assets is not a violation of securities laws, potentially paving the way for staking in ETH ETFs, with companies like BlackRock and Fidelity waiting for approval.
Ethereum Price Forecast: ETH to Tackle $4,100 Resistance, Eyes $4,500
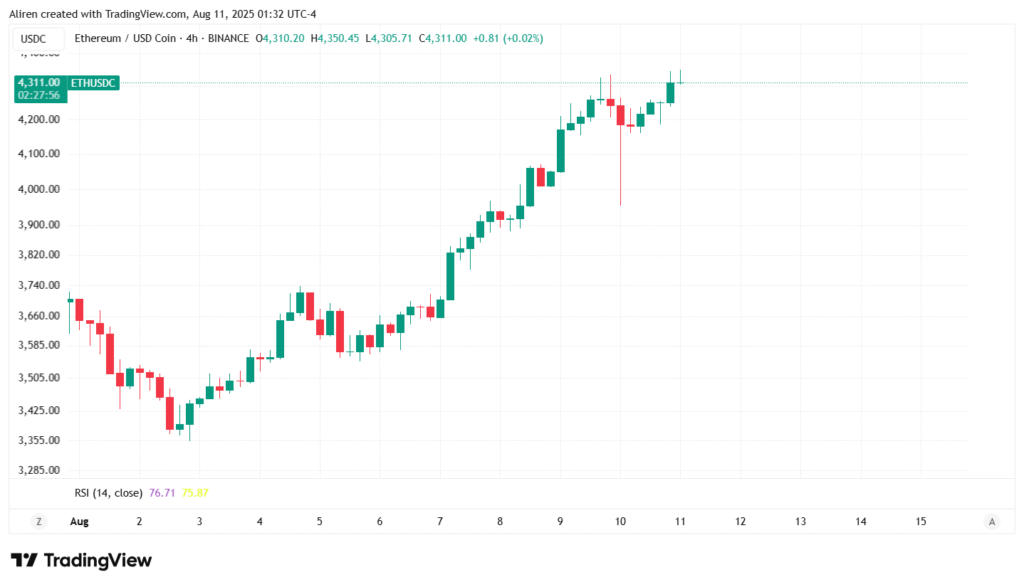
After finding support near $3,470 last week, ETH has risen about 15% and moved above $4,000 for the first time since December 2024. Now, the top altcoin is facing resistance from historical selling pressure near $4,100 and a downward trendline that stretches from its all-time high in November 2021.
If ETH successfully crosses above $4,100, it could signal another bullish pattern and push ETH’s rally towards the $4,500 resistance before trying to reach its all-time high of $4,868.
On the downside, ETH needs to hold the support at $3,470 to stay bullish. If it closes below this level for a week, it could drop to the $3,000 psychological level if the $3,220 support fails.
The Relative Strength Index (RSI) is close to entering the overbought region, and the Stochastic Oscillator (Stoch) has been in overbought territory since June. While these conditions show strong buying momentum, they also raise the chance of a short-term pullback.
Summary
Political events and economic data influence gold and crypto markets. Gold price is rising due to US tariffs on imports, though spot prices remain steady. US dollars await inflation data. Bitcoin and Ethereum are seeing positive investor sentiment driven by policy changes and increased adoption, but they face resistance levels that will impact their next moves. Traders should stay flexible, monitor economic indicators closely, and follow their risk management plans as market volatility remains high.
With UltraTrader’s trading journal app, trade smarter.