


How Did the US Dollar and Gold React to Cooling Inflation and Fed Signals?
The foreign exchange (forex) market exhibited moderate to high volatility this week, influenced by US economic data and global policy expectations. The US dollar weakened against major currencies as inflation cooled, boosting expectations for Federal Reserve rate cuts. Gold, as a safe-haven asset, benefited from this environment, posting gains amid a softening USD.
Gold Rallies on USD Weakness and Safe-Haven Demand from PCE Softness
Price Movement:
Gold (XAU/USD) reversed course on Friday, rising to $3,447, its highest level since June 16, after the US Personal Consumption Expenditures (PCE) inflation report met expectations. A weaker US Dollar (USD) boosted gold prices as traders anticipate Federal Reserve monetary policy easing in September.
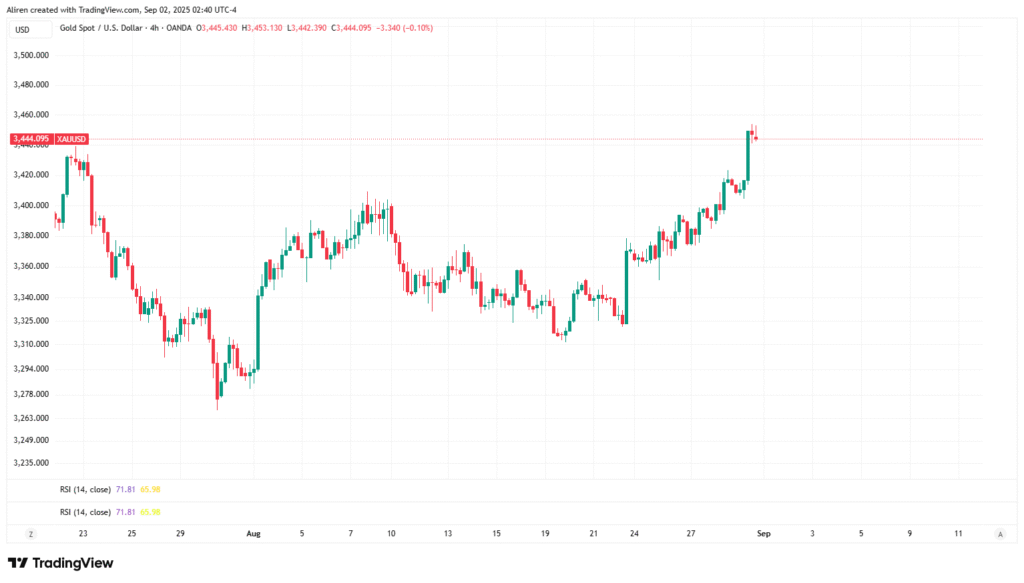
Currently, XAU/USD is up about 0.85% for the day, bouncing back from early levels near $3,404. The metal is on track for solid monthly gains due to safe-haven demand, expectations of Fed policy, and ongoing economic uncertainty. Concerns about the Fed’s independence have also increased Gold’s appeal.
Data showed the Core PCE Price Index rose 0.3% month-on-month in July, matching forecasts. Yearly core inflation increased to 2.9%, while headline PCE rose 0.2% month-on-month and held steady at 2.6% yearly.
Technical Analysis:
Gold (XAU/USD) reduced its losses on Friday after finding support just above $3,400, bouncing back toward Thursday’s high of $3,423. The $3,400 level now serves as immediate support, with further support at the 21-period Exponential Moving Average (EMA) around $3,395 and the 100-period EMA near $3,365.
The Relative Strength Index (RSI) is approaching overbought levels at approximately 70, suggesting that buyers may remain active as long as support holds at $3,400.
Thursday’s high of $3,423 is initial resistance. If Gold breaks above this, it could rise toward $3,450. However, if it falls below $3,400, it may drop to the $3,380-$3,370 range, where stronger support exists.
The upcoming US core PCE report will likely affect short-term movement, depending on whether Gold can hold above $3,400 or break above $3,423.
US Dollar Weakens Amid Softer PCE Data and Rate Cut Expectations
Price Movement:
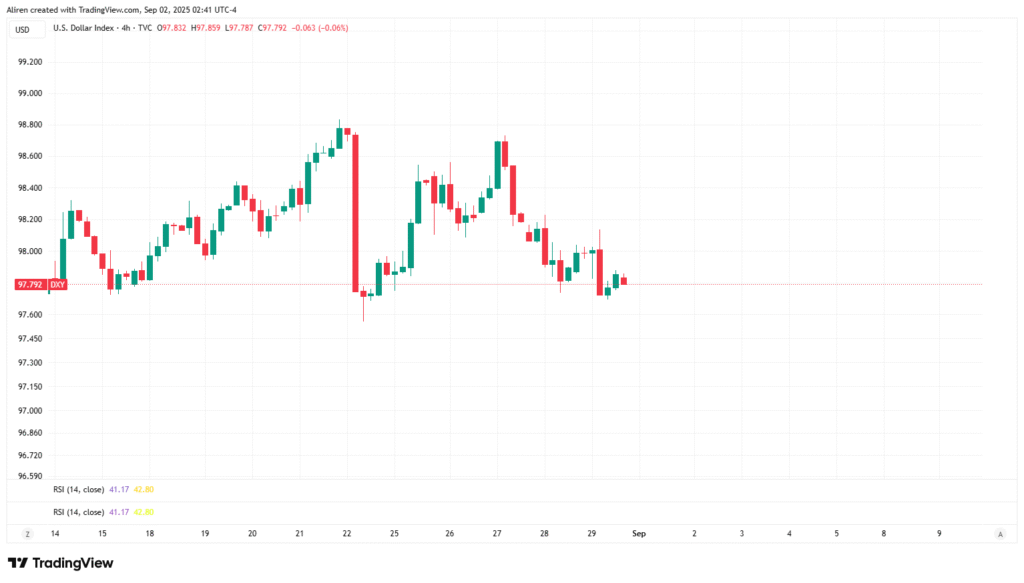
The USD experienced a notable decline against key pairs. The dollar index (DXY) started the week around 102.30 but fell to near 100 by the week’s end, reflecting a 1-2% drop against the euro (EUR/USD rising to near 1.0860-1.0950) and the pound (GBP/USD retracing to 1.2790 after reaching its highs). The USD/JPY climbed temporarily to 143.10 on a rise in risk appetite but pared gains amid yen strength. Emerging market currencies, such as the South African Rand and the Indian Rupee, experienced increased volatility due to fluctuations in commodity prices and geopolitical risks. Overall, the USD weakened by approximately 0.5-1% week-over-week, driven by softer inflation data.
Technical Analysis:
On the daily chart, the DXY formed a bearish flag pattern, testing support at 99.50-100, with resistance at 102-103. The RSI dipped below 30, signaling oversold conditions and a potential for a short-term rebound; however, the MACD continued to show bearish momentum with a negative histogram. Moving averages (50-day SMA at 101.50) acted as dynamic resistance, suggesting a range-bound scenario unless it breaks below 99.50, which could target 98. On a 4-hour chart, EUR/USD exhibited a bullish engulfing pattern near the 1.0835 support level, with potential upside to 1.0950 if it holds above the 200-day EMA (1.0850). Volume analysis indicated reduced selling pressure toward week’s end, hinting at consolidation.
Influencing News:
The Core PCE inflation data (released mid-week) came in cooler than expected at a softer year-over-year rate, reinforcing dovish Fed bets for a September rate cut. Second Q2 GDP revisions showed upward adjustments, but focus remained on PCE, which weakened the USD. New US tariffs on imports added pressure on risk-sensitive currencies, exacerbating volatility in pairs like AUD/USD (pressured around 0.6660 due to weak Chinese factory data). Eurozone PMI data provided minor support to EUR/USD, while caution from the Bank of England ahead of its policy decision influenced GBP/USD.
Crypto: How Did Bitcoin and Ethereum Respond to Fed Hints and Regulatory Buzz?
The crypto market showed mixed but predominantly bullish signals, with Ether forming a 31% rally amid regulatory tailwinds and institutional inflows. The total market cap rose to $3.87T (up 1.88% daily), driven by risk-on sentiment following the Fed’s hints, although flash crashes and liquidations added volatility.
Bitcoin Shows Resilience but Faces Fatigue Amid Rate Cut Optimism and Liquidations
Price Movement:
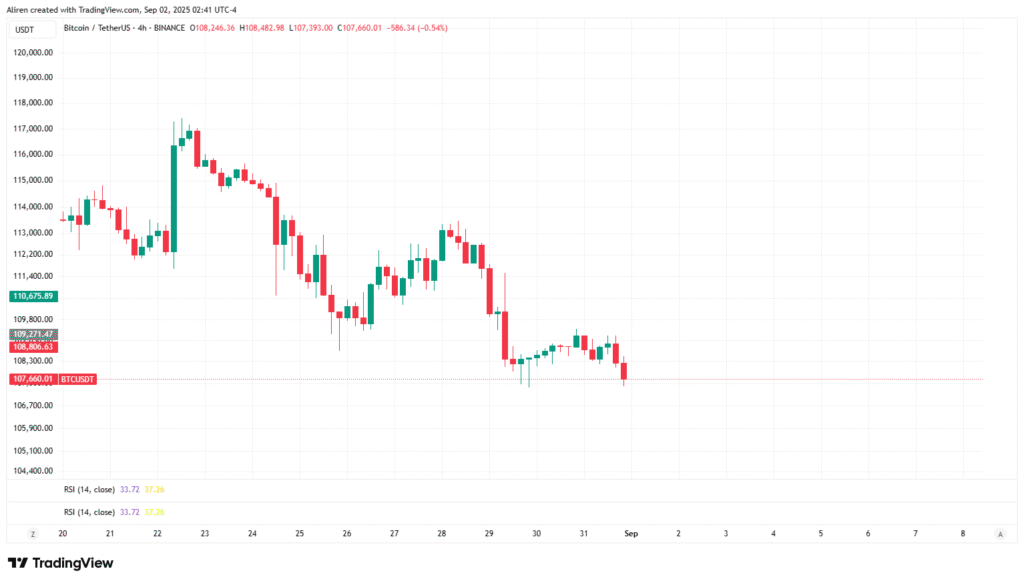
Bitcoin started the week around $107,000, climbing to $108,782 mid-week before a flash crash dipped it to $107,386. It closed at approximately $108,732 on August 31, up 0.28% daily but down 4.5% for the month. Year-to-date gains stood at 18%, with 24-hour volume at $169.23B. Whale activity and ETF inflows mitigated selling, but long liquidations ($175M) caused brief dips.
Technical Analysis:
On the 1-hour chart, BTC consolidated between $107,000 and $108,760, with a 0.29% daily gain. RSI at 50 indicated neutral momentum, while MACD hinted at a bullish crossover if it holds above $108,000. Weekly charts indicated a bear flag, with downside risk to $105,000-$107,000 if $107,000 is breached; upside targets include $110,000-$113,600 on a rebound. The 200-day SMA ($100,000) provided long-term support, and supply in profit at 90% suggested potential corrections. Oversold signals and whale accumulation offset bearish pressure.
Influencing News:
Fed rate cut hints (from Powell’s Jackson Hole speech) triggered a rally, but new tariffs caused $245M in long liquidations. ETF outflows ($1B for week ending August 22) slowed inflows, with “BTC fatigue” noted amid ETH outperformance. Japan’s potential Bitcoin reserve and Metaplanet’s $880M raise boosted adoption sentiment.
Ethereum Surges on Institutional Inflows and Network Upgrades Despite BlackRock Sell-Off
Price Movement:
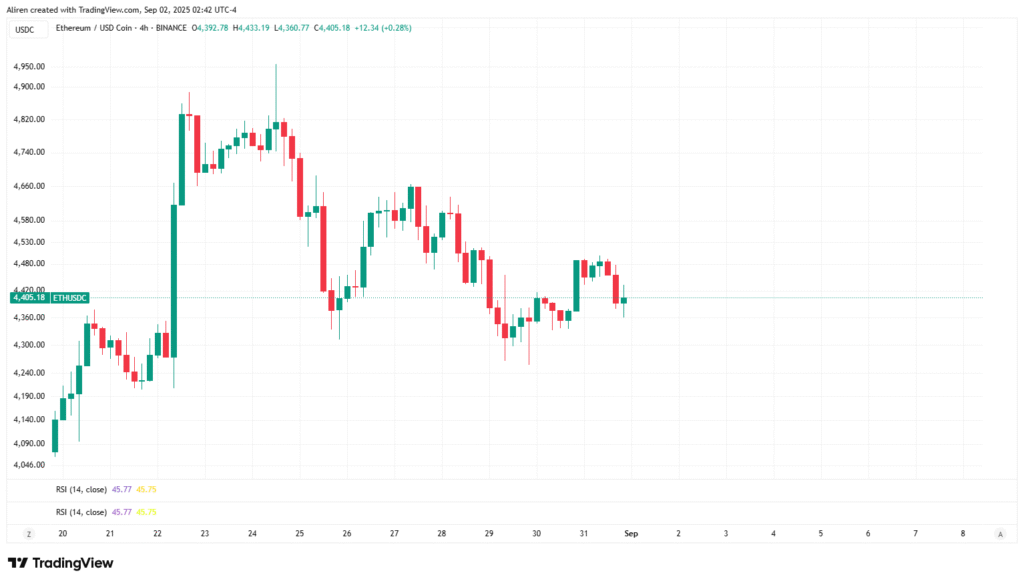
Ethereum surged to a new high near $4,885 mid-week before settling at $4,362.89 by August 31, up 1.80% daily, 2.94% weekly, and 13.51% monthly. It broke a three-year negative August streak with 23% gains, driven by ETF inflows and network upgrades. The 24-hour volume reached $32.34 billion, with a market capitalization of $ 526.63 billion.
Technical Analysis:
Daily charts displayed strong buying momentum, reaching $4,900 before dropping to the $4,400 support level. The RSI was above 70, indicating overbought conditions, but buying continued. A breakout above $4,500 could push prices to $4,900-$5,500. On the 4-hour charts, ETH formed a bullish pattern at $4,455, with support at the 50-day SMA of $4,200. Volume increased during Powell’s speech, confirming the upward trend, but the overbought RSI suggests potential corrections to $4,363.39.
Influencing News:
Powell’s dovish comments sparked a 15% surge, breaking 2021 highs. BlackRock’s $272 million sell-off had a minimal impact amid shrinking supply and growth in ETH ETF AUM (up 31% monthly). The SEC’s delays on altcoin ETFs (e.g., Solana, XRP) have shifted the focus to ETH’s dominance, with forecasts predicting a year-end price of $6,100.
Additional Key News Impacting Markets
- Fed’s Jackson Hole Symposium: Powell’s speech (Aug. 22-23) emphasized the need for rate adjustments, aimed at cooling inflation fears and boosting risk assets.
- August 22: Geopolitics and Lingering Effects from Early August Tariffs Trigger Crypto Volatility; Ongoing Russia-Ukraine and Middle East Tensions Support Gold.
- Regulatory and Adoption Trends: SEC ETF delays (August 22) and Japan’s Bitcoin reserve proposal added bullish crypto narratives; Texas’s SB21 (August 28) established a state BTC reserve.
- MacroAugust 31rable goods and consumer confidence (Aug. 26-27) reinforced growth concerns, while token unlocks (e.g., Echelon Prime on August 31) posed minor crypto risks.
Conclusion: Risk-On Sentiment Prevails, but Volatility Looms Ahead
From August 24 to 31, the market exhibited a positive trend, driven by signals from the Federal Reserve indicating that interest rates would remain low, following weaker PCE data and comments from Powell at Jackson Hole. This led to a weaker US dollar, rising gold prices, and increased interest in cryptocurrencies, particularly Ethereum, over Bitcoin.
In the forex market, USD pairs recovered after being oversold, while Gold gained appeal amid geopolitical concerns. Institutional investments in cryptocurrency have helped offset sell-offs, but there has been noticeable “BTC fatigue,” suggesting a shift toward other cryptocurrencies.
Looking ahead, the upcoming US jobs report (non-farm payrolls) may influence the September data. Key levels to watch include: DXY support at 99.50, gold resistance at $3,500, Bitcoin at $107,000, and Ethereum at $4,500. The expectation of easier policies supports a positive trend, but trade tariffs and economic risks could cause sudden shifts, so stay cautious this September.