


Gold Dips From Highs as December Rate Cut Hopes Fade
Gold spent the week under pressure after an impressive rally in previous months. At the start of the period, spot prices were trading just above the 4,050 – 4,080 dollar area and briefly moved above 4,100 dollars. However, a stronger US dollar and reduced expectations of a December rate cut pushed the metal lower, with prices testing the 4,000 dollar region before stabilizing again toward the weekend.
Markets reacted to hawkish comments from Federal Reserve officials and a series of data points that suggested the Fed might delay further easing. As the probability of a near-term cut moved lower, yields ticked higher, and some speculative length in gold was reduced. Even so, the metal remained close to historical highs, supported by central bank demand and ongoing macro uncertainty.
Precious Metals Sentiment Turns Cautious As Fed Repricing Weighs
Recent research notes highlighted that central bank gold buying stays strong, but short-term traders are turning more cautious. The sharp repricing of rate cut odds, together with a firmer dollar, made it harder for gold to extend its breakout. At the same time, risk sentiment in broader markets was weak, which limited the downside through safe-haven flows.
Investors are now watching delayed US jobs data, the latest Fed minutes, and upcoming inflation releases for more clarity on the policy path into early 2026. Any confirmation that cuts are only postponed and not cancelled could quickly bring dip buyers back into gold.
Technical Outlook:
Technically, gold has moved into a consolidation phase near the top of its long term range. The 4,000 dollar level is now the first key support, followed by the 3,950 dollar area and the 20 day moving average slightly below. If these levels hold, the broader bullish structure remains intact.
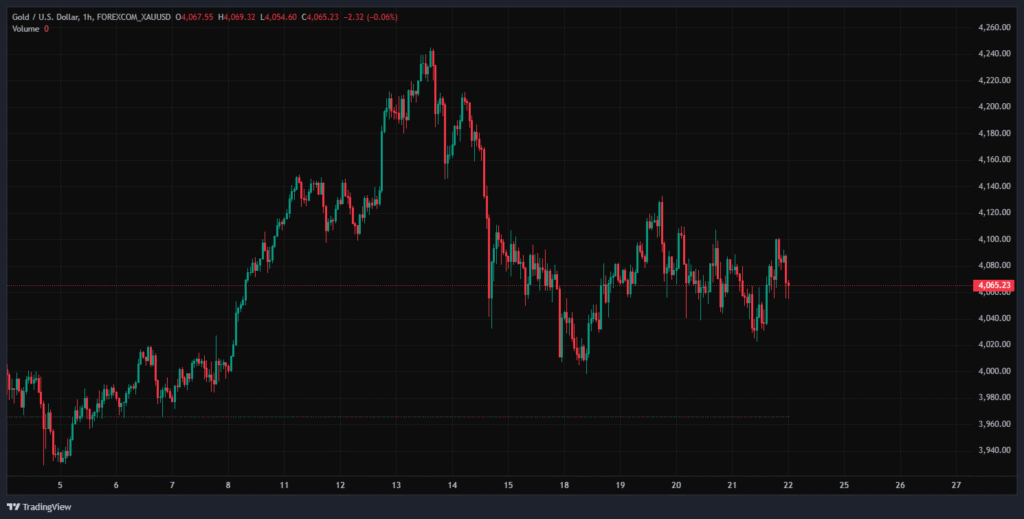
On the upside, initial resistance sits around 4,120 – 4,150 dollars, with the recent peak just above that zone acting as the next target. A daily close back above 4,150 dollars would open the door for a retest of the record high. A clear break below 4,000 dollars, however, could signal a deeper corrective move toward 3,900 dollars and the medium-term trend line.
The US Dollar Index (DXY) Climbs Back Above 100 As Markets Digest Fed Signals
The US dollar strengthened over the week, reversing part of its earlier pullback. The Dollar Index started Monday just under 99.6 and briefly dipped toward the mid-99 area before pushing higher. By mid-week, DXY had reclaimed the 100 level and finished the period trading slightly above that psychological barrier.
The move was driven by firmer yields, reduced expectations for a December rate cut, and a fresh round of safe-haven demand as risk assets weakened. While the data picture is mixed, Fed officials continued to signal caution on easing too quickly, which helped the dollar.
Technical Analysis:
From a technical perspective, the dollar has defended support in the high 98s and low 99s and is now testing resistance between 100.0 and 100.5. A sustained close above this band would confirm a short-term bullish breakout and put the early autumn highs back on the table.
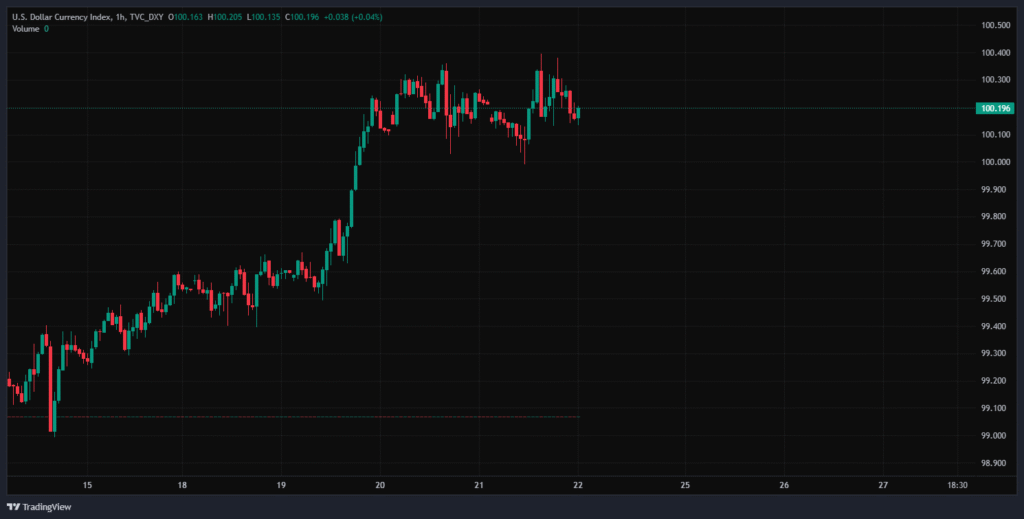
If the index fails to hold above 100, traders will be watching support around 99.5 and then 98.8 – 98.5. A break below those levels would signal that the latest bounce was only corrective and could bring back the broader bearish narrative that dominated earlier in the quarter.
BTC Falls To Multi-Month Lows As Liquidity Dries Up
The price of Bitcoin (BTC) extended its recent downtrend this week, with the market sliding to fresh multi month lows. After closing the previous week near 99,000 dollars, BTC started the period still above 95,000 dollars but could not hold that level for long. Selling pressure accelerated on Monday and Tuesday, sending the price toward the low 90,000s, and by later in the week, Bitcoin traded briefly below 90,000 dollars before stabilizing in the mid 80,000s.
The move reflects more than just technical weakness. Crypto has been hit by a broad shift in risk appetite, ongoing concerns about an overheated tech and AI theme, and a reassessment of how aggressive the Fed can be with rate cuts. Together, these factors have driven out leveraged longs and encouraged long term holders to take profits after the record highs earlier in the year.
Wave Of Liquidations And Thin Liquidity
Derivatives data showed another spike in liquidations as BTC broke below key support zones. A pocket of long positions around the low 90,000s was flushed out when the price dropped through that area, triggering a cascade of stop losses. Lower liquidity on major exchanges amplified the move, causing larger than usual intraday swings.
The crypto fear and greed index dropped back into deep fear territory, mirroring the mood seen in earlier corrections this year. While some on chain metrics suggest that stronger hands are beginning to accumulate, overall positioning remains cautious.
Macro Uncertainty Keeps Risk Appetite Weak
The macro backdrop has not been friendly for high beta assets like Bitcoin. Talk of delayed rate cuts, worries about a possible tech bubble, and choppy equity markets all weighed on sentiment. ETF flows have softened, and several large holders have reduced exposure, putting additional pressure on the market.
At the same time, most analysts see the latest drop as part of a broader reset rather than a complete collapse in the long term story. As in previous cycles, corrections of 25 to 30 percent after new highs are not unusual, especially when leverage has built up.
What’s Next For BTC?
Technically, Bitcoin now faces strong resistance around 92,000 – 95,000 dollars, an area that previously acted as support. Bulls will need to reclaim this zone on a closing basis to signal that a durable bottom is forming. Above that, 100,000 dollars is the next major psychological level.
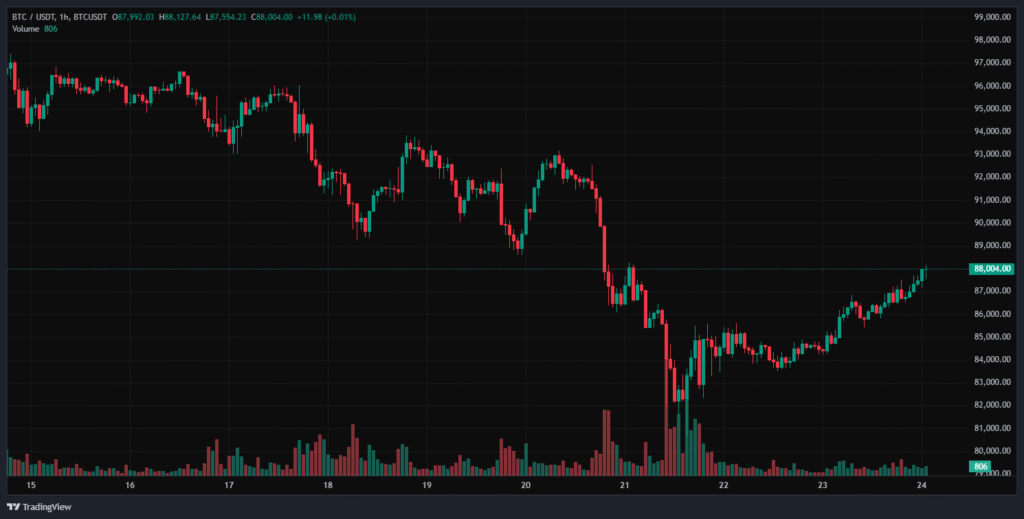
On the downside, the mid 80,000s and then the 80,000 dollar region are the key supports to watch. A decisive break below 80,000 dollars would likely trigger another round of liquidations and could push BTC toward prior consolidation zones lower down. For now, price action suggests a market that is trying to build a base but has not yet confirmed a trend reversal.
Ethereum Hits Four-Month Low As Leverage Resets Across Majors
Ethereum (ETH) underperformed Bitcoin this week and fell to its lowest level in more than four months. At the start of the period, ETH was trading close to 3,100 – 3,200 dollars. As selling pressure spread across the crypto complex, ETH dropped sharply, with intraday lows on Wednesday and Thursday taking the price below 2,900 dollars and even under 2,800 dollars at one point.
A series of long liquidations in ETH futures and perpetual swaps, together with increasing short interest, accelerated the decline. At the same time, some institutional desks used the weakness to adjust their exposure, contributing to higher volumes and volatility. By the end of the week, Ethereum had recovered slightly and was trading back in the high 2,700s.
Heavy selling wiped out a large portion of leveraged positions on major exchanges. Open interest declined as traders cut risk, while funding rates moved closer to neutral or slightly negative, indicating a more balanced derivatives market after weeks of stretched positioning.
Ethereum Price Forecast: ETH Struggles To Reclaim The $3,000 Key Level
From a technical point of view, the 3,000 dollar level has become a key pivot for Ethereum. It now acts as immediate resistance after being lost during the sell-off. A daily close back above 3,000 dollars would be the first sign that bulls are regaining control. The next resistance zone sits around 3,150 – 3,250 dollars, where the market failed several times this month.
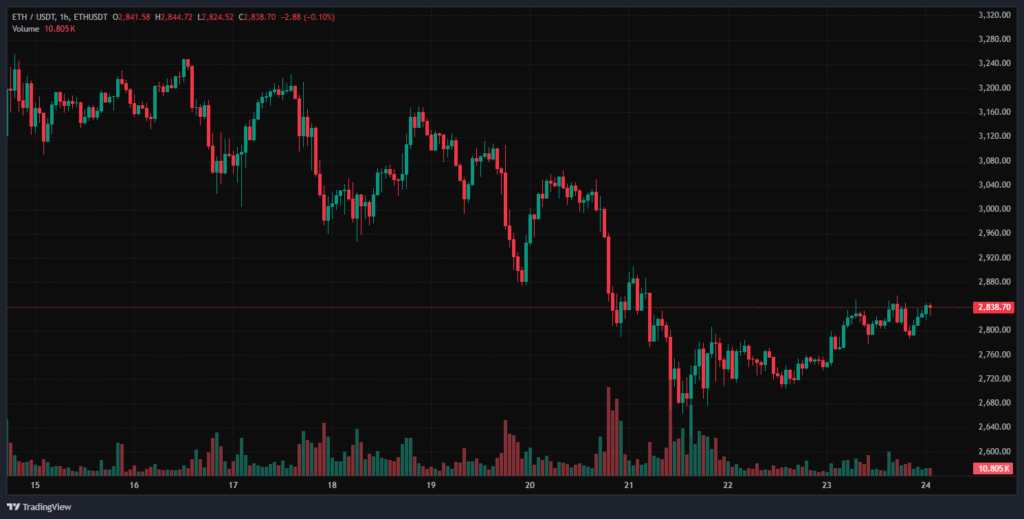
On the downside, initial support lies in the 2,750 – 2,700 dollar band, with deeper support projected near 2,600 – 2,550 dollars if selling resumes. Momentum indicators are oversold but not extreme, which suggests that while a short term bounce is possible, a gradual bottoming process may be more likely than a rapid V shaped recovery.
Weekly Market Wrap-Up
This week highlighted a strong contrast between traditional havens and digital assets. Gold pulled back from recent highs as the market reduced the probability of an immediate Fed rate cut, but it remained comfortably above 4,000 dollars and continues to be supported by central bank buying and long term uncertainty. The US dollar regained strength and pushed back above the 100 level on the DXY, helped by firmer yields and a cautious Fed tone.

Start Journaling Today

Start Journaling Today
In the crypto space, the picture was very different. Bitcoin slid to new multi month lows after breaking key support levels, while Ethereum dropped to a four month low as liquidations and de leveraging swept through the market. Both assets showed signs of stabilization toward the end of the week, but technical structures are still fragile and sentiment remains weak.
Looking ahead, traders will focus on upcoming US data, Fed communications, and equity market behavior to judge whether this is simply a mid cycle shakeout or the start of a deeper risk off phase. Key levels to watch are 4,000 dollars in gold, the 100 mark on the dollar index, 90,000 dollars in Bitcoin, and the 3,000 dollar area in Ethereum.