


The week of August 10–17 saw volatility in forex and crypto markets, driven by U.S. economic data, tariffs, and geopolitical events. Below, we analyze price movements, technical outlooks, and key influences for the U.S. Dollar Index (DXY), gold (XAU/USD), Bitcoin (BTC), Ethereum (ETH), and altcoins.
Gold Remains Strong Despite Global Conflicts and Economic Issues
Price Movement:
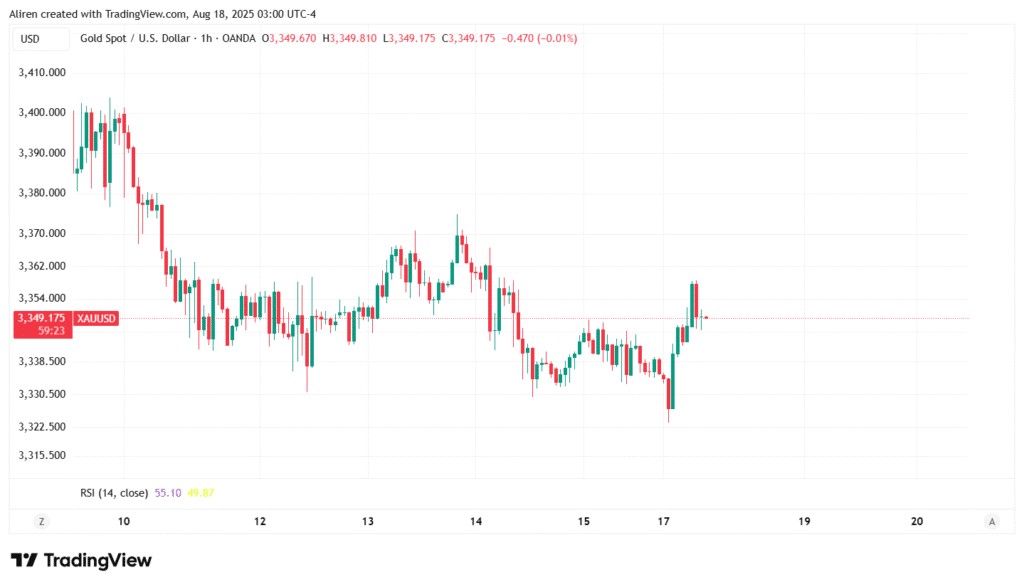
Gold (XAU/USD) held steady, closing at $3,340 on Friday, August 15, 2025, up 0.17% for the week but down 1.8% overall due to earlier declines, per web data. Prices traded tightly between $3,330 and $3,350, supported by geopolitical uncertainty and a weaker dollar but capped by high U.S. Treasury yields (10-year at 4.28%, 30-year at 4.85%). Tariff-driven inflation concerns and weaker economic data bolstered gold’s safe-haven appeal.
Technical Analysis
- Trend: Bullish but consolidating below the 50-day SMA resistance at $3,349–$3,357.
- Key Levels: Support at $3,330, with a deeper level at $3,295 (100-day SMA). Resistance at $3,357, $3,380, and $3,400, targeting $3,452 (June 16 high).
- Indicators: The daily RSI is neutral at 50, reflecting indecision. The MACD’s flattening histogram indicates a lack of strong momentum.
- Outlook: A breakout above $3,357 could push gold to $3,400, while a drop below $3,330 may test $3,295. Fed signals and tariff developments will be critical.
Key News
- Economic Pressures: High Treasury yields and rising inflation expectations (10-year TIPS real yield at 1.90%) limited gains, but a weaker dollar and economic slowdown supported gold’s stability.
- Tariff Exemptions: Trump’s exclusion of 1-kilo gold bars from tariffs eased prices early in the week, but a new tariff announcement on gold bars on Thursday added volatility.
- Geopolitical Support: Ongoing Middle East tensions (Israel-Iran conflict) and tariff-related trade disruptions bolstered gold’s safe-haven demand.
The dollar is facing challenges due to increasing tariffs and rising inflation pressures.
Price Movement:
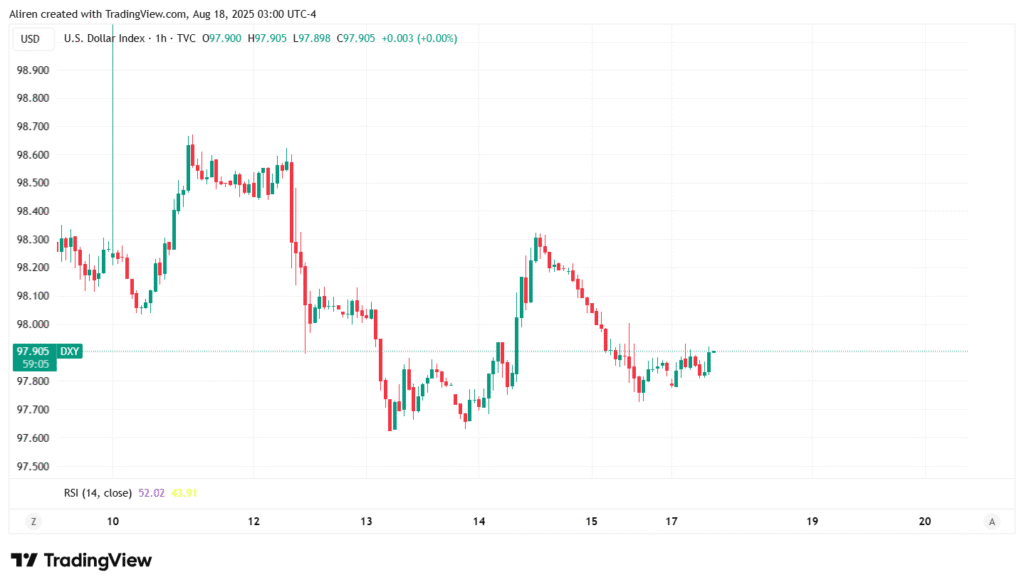
The U.S. Dollar Index (DXY) fell 0.37% to 97.83 on Friday, August 15, continuing its decline. After a better-than-expected Producer Price Index (PPI) showed a 2.6% increase year-over-year in June, the dollar briefly rose. However, gains faded due to favorable market sentiment, rising inflation expectations, and lower consumer confidence, with the University of Michigan Consumer Sentiment index at 61.7 in July. While U.S. Retail Sales for July met expectations and June figures improved, factory orders dropped 4.8%, and ISM Services PMI fell to 50.1%, signaling an economic slowdown that pressured the dollar.
Technical Analysis
- Trend: Bearish, with DXY failing to hold above 98.00 and testing support at 97.83.
- Key Levels: Support at 97.50, with a deeper level at 96.35 (23.6% Fibonacci retracement of the 2025 uptrend). Resistance at 98.35 and 99.00 (50-day SMA).
- Indicators: The daily RSI is at 42, indicating neutral-to-bearish momentum. The MACD shows a bearish crossover, suggesting further declines unless risk-off sentiment strengthens.
- Outlook: A break below 97.50 could target 96.35, while a close above 98.35 may signal a reversal, potentially driven by rising Treasury yields (10-year at 4.28%) post-FOMC minutes.
Key News
- Inflation Surge: Thursday’s PPI shock reduced expectations for a 50-basis-point Federal Reserve rate cut, with markets pricing a 90% chance of a 25-basis-point cut in September. Tuesday’s CPI data, forecasted at 2.8% headline and 3.0% core, supported rate-cut hopes earlier in the week.
- Economic Data: The labor market shows signs of weakness with a 73,000 increase in nonfarm jobs, an unemployment rate of 4.2%, and rising jobless claims of 226,000 for the week ending August 2. Next week’s Flash PMI report, the FOMC minutes, and Powell’s speech at Jackson Hole from August 21 to 23 may increase market volatility.
- Tariffs: Trump’s 50% tariffs on India for buying Russian oil and a 100% tariff on semiconductors (with exemptions for U.S.-based production) added uncertainty, briefly supporting the dollar midweek.
Trump-Putin Summit and its impacts on the market.
The August 15, 2025, meeting between U.S. President Donald Trump and Russian President Vladimir Putin in Alaska aimed to negotiate a ceasefire in the Russia-Ukraine conflict but ended without a deal, described as “constructive” but inconclusive. Its impacts were:
- U.S. Dollar (DXY): Optimism for progress fueled risk-on sentiment, contributing to the DXY’s 0.37% drop to 97.83 as investors favored riskier assets. The lack of a breakthrough sustained this pressure, though escalation could bolster the dollar as a haven.
- Gold (XAU/USD): Hopes of peace talks softened gold’s safe-haven appeal, leading to a 1.8% weekly decline despite a stable close at $3,340. Continued uncertainty could push prices toward $3,400, while a ceasefire might reduce demand.
- Bitcoin and Ethereum: The inconclusive outcome prompted cautious selling, with BTC dipping to $117,500–$121,500 (-1.3%) and ETH falling to $4,100–$4,440 after hitting $4,700. A peace deal could trigger a short-term crypto dip as funds shift to equities, but Trump’s pro-crypto policies support long-term gains.
- Altcoins: Altcoins like Solana, Cardano, and XRP dropped 2–3% post-summit due to risk-off sentiment, though pro-crypto policies limited losses.
Bitcoin Soars to Record Highs but Faces Pullback Risks
Price Movement:
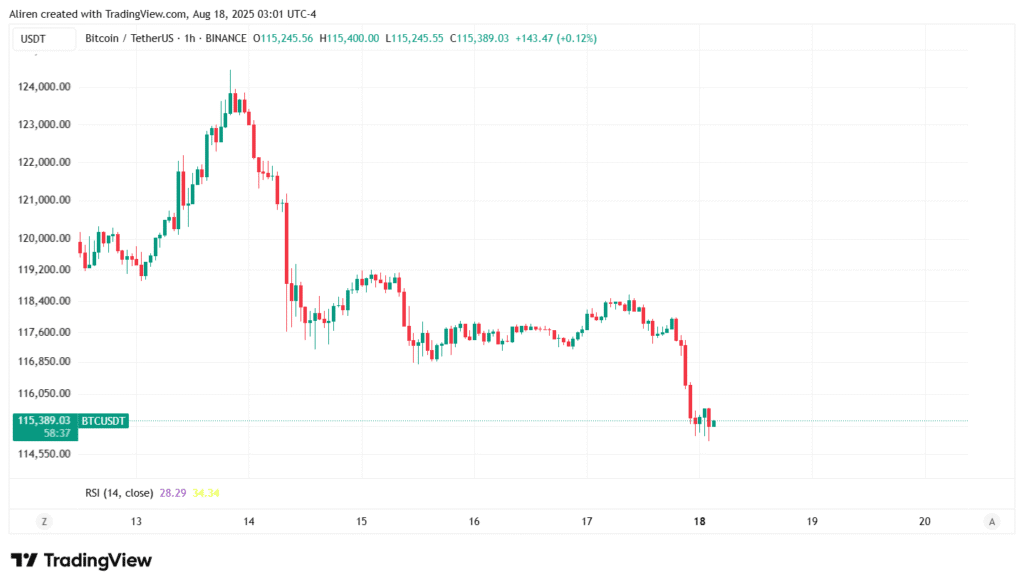
Bitcoin (BTC) surged to a record high of $124,474 on Thursday, August 14, before dropping 4% to $118,800 by Friday, August 15. Trump’s pro-crypto policies and $720 million in ETF inflows drove the rally, but a $1.89 billion unwind of long positions and tariff concerns sparked caution.
Technical Analysis
- Trend: Consolidating in a symmetrical triangle near $117,500–$121,500 after a strong uptrend.
- Key Levels: Support at $116,000 (Fibonacci level), with a deeper level at $113,422 (50-day EMA). Resistance at $124,474 (all-time high) and $130,000.
- Indicators: The daily RSI is at 54, above neutral but fading. The MACD’s bullish crossover from Monday is weakening.
- Outlook: A break above $124,474 could target $130,000, while a drop below $116,000 may test $113,422. Fed signals and corporate buying will drive direction.
Key News
- Pro-Crypto Policies: Trump’s executive order for a U.S. Crypto Strategic Reserve and crypto inclusion in 401(k) plans fueled bullish sentiment.
- Inflation Data: Tuesday’s CPI (2.8% headline) raised rate-cut hopes, lifting BTC early, but Thursday’s high PPI triggered the 4% drop.
- ETF Inflows: Year-to-date BTC ETF inflows hit $50 billion, with $720 million added this week.
- Corporate Buying: Companies acquired $3.4 billion in BTC, tightening supply.
Ethereum Rallies on Upgrade Hype but Tests Critical Levels
Price Movement:
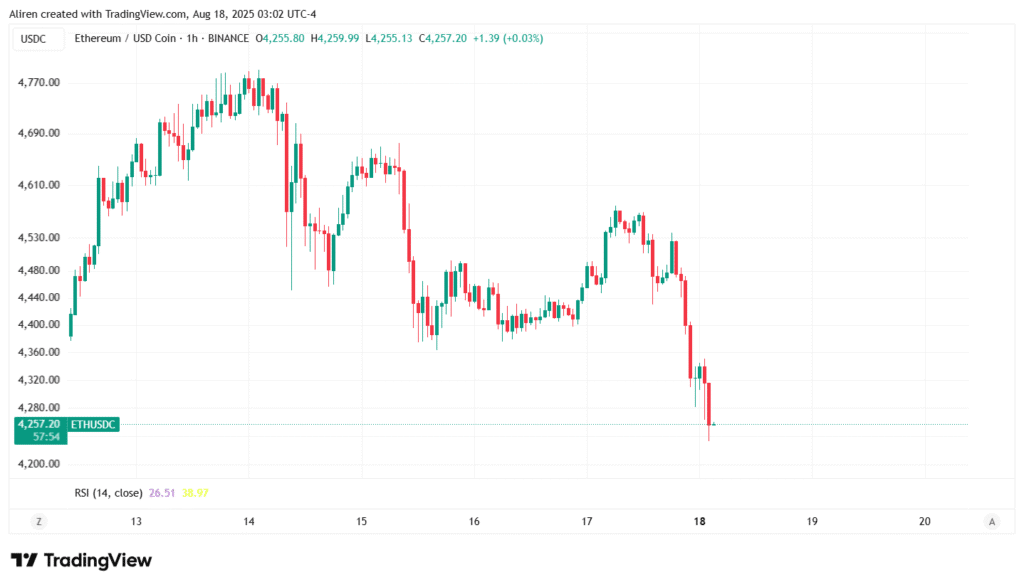
Ethereum (ETH) surged 17.2% for the week, peaking at $4,700 before dropping 2% to $4,300 by Friday, August 15. X posts suggest ETH traded at $4,100–$4,440 on Sunday, August 17. The Pectra upgrade and institutional buying drove gains, but SharpLink Gaming’s $103 million loss and $169 million in futures liquidations sparked the pullback.
Technical Analysis
- Trend: Testing a bearish head-and-shoulders neckline at $4,100–$4,440 after failing to reclaim $4,700.
- Key Levels: Support at $4,100 (historical resistance), with a deeper level at $3,500 (50-day EMA/SMA). Resistance at $4,500 and $4,868 (2021 high).
- Indicators: The daily RSI is at 39.27, nearing oversold, suggesting a potential bottom. The Stochastic Oscillator is retreating from overbought levels, and the MACD shows declining bullish momentum.
- Outlook: A break below $4,100 could target $3,500, confirming the bearish pattern. A reclaim of $4,500 would eye $5,000.
Key News
- Pectra Upgrade: Activated May 7, 2025, it improved wallet functionality and L2 scaling, boosting ETH by 18.8% on May 8.
- Institutional Moves: BlackRock’s $158 million ETH investment and SharpLink’s 728,000 ETH treasury supported prices despite losses.
- Regulatory Uncertainty: Senate probes into Trump’s crypto ties and SEC guidance on liquid staking added volatility.
- Retail Activity: Strong Korean buying offset declining ETF inflows.
Altcoins Ride Bitcoin’s Wave but Face Summit-Driven Dips
Price Movement
Altcoins followed BTC and ETH, gaining early before dipping post-summit. Solana (SOL) rose 15% to $350 but fell 2% to $343 by Sunday. Cardano (ADA) gained 10% to $0.75, dropping 3% to $0.73. XRP surged 20% to $1.50, driven by Ripple’s $500 million RLUSD stablecoin launch, but shed 2% to $1.47. The crypto market cap held at $4.1 trillion, with BTC dominance at 57%.
Technical Analysis
- Trend: Consolidating after uptrends, with bearish patterns like SOL’s double-top at $350.
- Key Levels: SOL support at $330, resistance at $360. ADA support at $0.70, resistance at $0.80. XRP support at $1.40, resistance at $1.60.
- Indicators: RSIs are mixed (SOL at 50, ADA at 45, XRP at 52), showing neutral momentum. MACDs indicate fading bullish signals.
- Outlook: Corrections are possible if BTC drops below $116,000, but pro-crypto policies could drive SOL to $400, ADA to $0.90, and XRP to $1.80.
Bottom Line
Markets faced ups and downs during the past week. The U.S. Dollar (DXY) dropped 0.37% to 97.83 due to risk appetite, tariffs, and inflation data.
Gold stayed steady at $3,340, losing 1.8% overall, influenced by geopolitical tensions but affected by high Treasury yields. The Trump-Putin summit on August 15 ended without a ceasefire, boosting risk appetite, which weakened the dollar and gold while causing slight dips in cryptocurrencies (BTC fell 1.3% to $117,500–$121,500, ETH ranged from $4,100 to $4,440).
Bitcoin rose 2.2% thanks to $720 million in ETF inflows, but risks dropping below $116,000. Ethereum increased 17.2% after the Pectra upgrade but may fall to $3,500 if it drops below $4,100. Altcoins like SOL, ADA, and XRP rose by 10–20% but dipped 2–3% after the summit.