


This past week, the US dollar showed its strength in the global financial market. A strong approach from the Federal Reserve and positive economic data led to a sharp rise in US Treasury yields. This affected different markets, including commodities and cryptocurrencies. In the cryptocurrency market, Bitcoin remained stable, while altcoins struggled to gain ground.
Gold reached $3,600 amid weak job reports and speculation about a rate cut.
The US jobs report, which many were waiting for, confirmed what Fed Governor Christopher Waller said: the labor market has been showing some issues since late July 2025. The data was disappointing; the unemployment rate increased, and average hourly earnings remained unchanged.
As a result, Treasury yields fell sharply. The most significant drop was in the 2-year Treasury note, which is most affected by changes in expectations for the Fed funds rate. Currently, the US 2-year T-note has fallen over 11 basis points to 3.48%.
Concerns about the Federal Reserve’s independence, following Trump’s attempt to fire Fed Governor Lisa Cook, are hurting the dollar and boosting interest in gold.
Analysts at Standard Chartered Bank predict a 50-basis-point rate cut in September, citing last year’s weaker employment data. They expect upcoming revisions to employment data from April 2024 to March 2025 to support their forecast.
Gold traders are closely watching next week’s Consumer Price Index (CPI) figures in the US. If inflation decreases, it could strengthen the case for a rate cut at the Federal Reserve meeting on September 16-17.
Technical Analysis:
Gold price is still rising as traders have pushed spot prices above $3,600. Recently, XAU/USD has traded between $3,590 and $3,600 as the weekend approaches, and it seems unlikely that $3,600 will hold until the close.
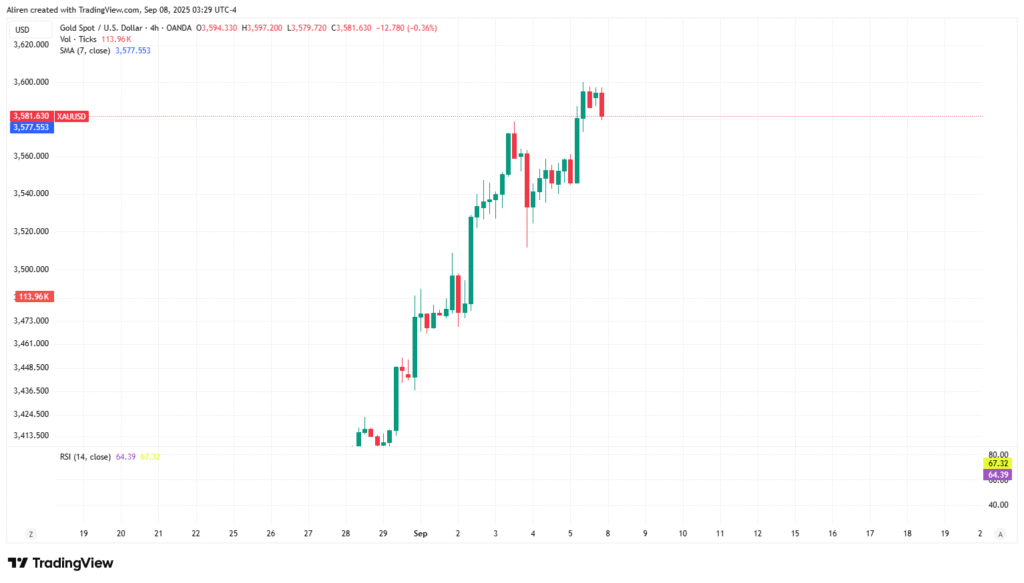
If prices break through $3,600, the following essential resistance levels will be $3,650 and $3,700. On the other hand, if the daily closing price remains below $3,600, it will expose the swing low from September 4 at $3,511, with the next target being $3,500.
Dollar Tumbles on Weak US Unemployment Report
The dollar index (DXY) fell 0.59% on Friday, hitting a 1.5-month low due to a weak US unemployment report and rising expectations for Federal Reserve interest rate cuts. The 10-year Treasury note yield dropped seven basis points to 4.09%, and the 2-year Treasury note yield also fell seven basis points to 3.52%.
The August payroll report showed only 22,000 new jobs, far below the expected 75,000. The average increase over the last three months was just 29,000. July’s payrolls were revised slightly higher to 79,000, while June’s were revised down to a loss of 13,000. Private payrolls added only 38,000 jobs, and employment in manufacturing fell by 12,000. The unemployment rate rose by 0.1 percentage points to 4.3%, the highest in 3.75 years, aligning with market expectations.
Technical Analysis:
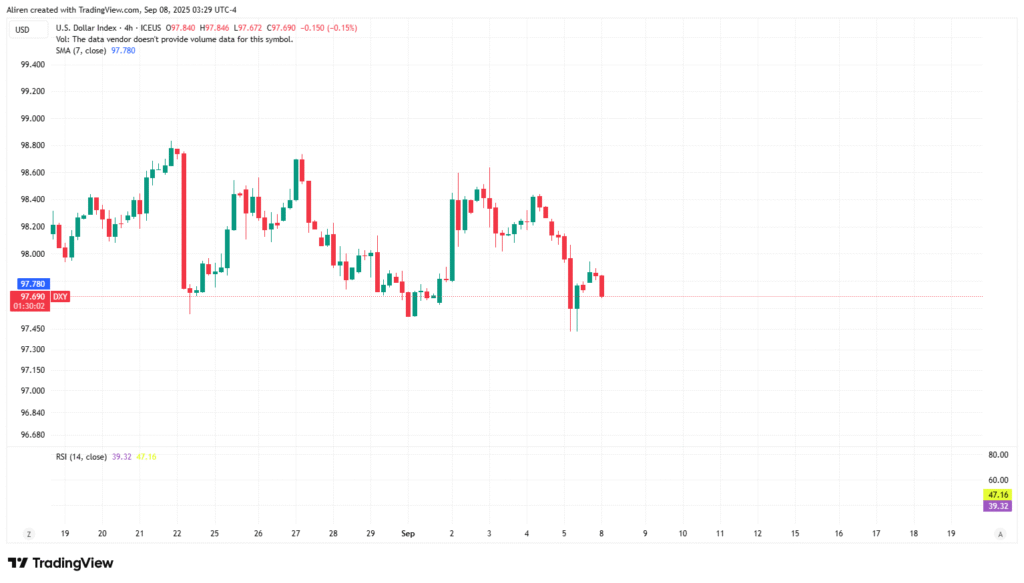
On Thursday, the DXY index failed to break through the key resistance level of 98.45, signaling a strong sell signal. This level now acts as significant resistance. Following this, the index fell by 0.35% to just below the significant psychological mark of 98.00. Dropping below 98.00 is a bearish sign that could lead to further declines. The trend is clearly downward, and unless US economic data improves and rate cut expectations change, the DXY is likely to remain under pressure.
US Treasury Secretary Scott Bessent says the Fed must re-establish its credibility.
U.S. Treasury Secretary Scott Bessent warned that the Federal Reserve needs to rebuild its credibility and trust with the American people. He spoke during an interview with the Wall Street Journal published on Friday. This warning comes on the heels of a disappointing Nonfarm Payrolls report, which revealed that the U.S. economy added only 22,000 new jobs in August. This sharp decline in hiring is primarily attributed to the trade tariffs and potential immigration policies introduced by the Trump administration.
Bitcoin & Ethereum: The Apathetic Market Awaits a Spark
Bitcoin (BTC) Testing Important Support Level and May Experience Price Swings
Bitcoin faced another rejection at the 113,000 resistance this week, as detailed in recent market analysis, leading to a pullback toward the critical 110,000 support level. Starting Sunday at approximately $112,500, it dipped to $110,200 mid-week amid macroeconomic volatility but recovered slightly to close around $111,000. This price action reflects ongoing consolidation, with on-chain data indicating stagnant new wallet creations and low speculative leverage, pointing to market apathy.
Technical Analysis:
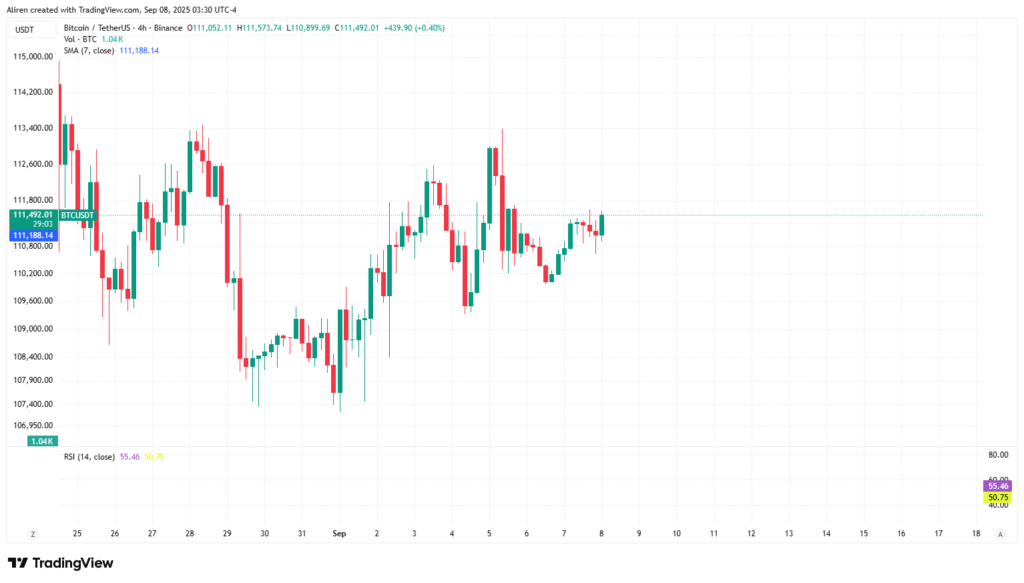
The chart indicates Bitcoin is in a tight range, with Bollinger Bands at multi-month lows, suggesting a volatility squeeze. A bearish engulfing pattern emerged around September 3-4, following a rejection at 113,000, which increased downside risks. Key support at 110,000 is critical—if it holds, we could see a rebound to 113,000 or 115,000. However, a break below 110,000 would be bearish, potentially leading to a price target of 108,000 or lower. The RSI is neutral at 50, and low volume suggests that traders are waiting for macroeconomic cues, such as the CPI.
Ethereum (ETH): Consolidation Persists Amid Mixed Signals, With Potential for Directional Moves
Ethereum has been consolidating between $4,232 and $4,488, currently around $4,310. This reflects trader uncertainty, influenced by a weak jobs report. While there are hints of a rebound, a clear breakout is still absent, mirroring broader market hesitance. Meanwhile, record stablecoin inflows are boosting liquidity in sectors like DeFi and NFTs. However, Ethereum’s price movements remain influenced by Bitcoin’s consolidation, and vigorous on-chain activity hasn’t prompted aggressive buying without key triggers, such as upcoming CPI data.
Technical Analysis:
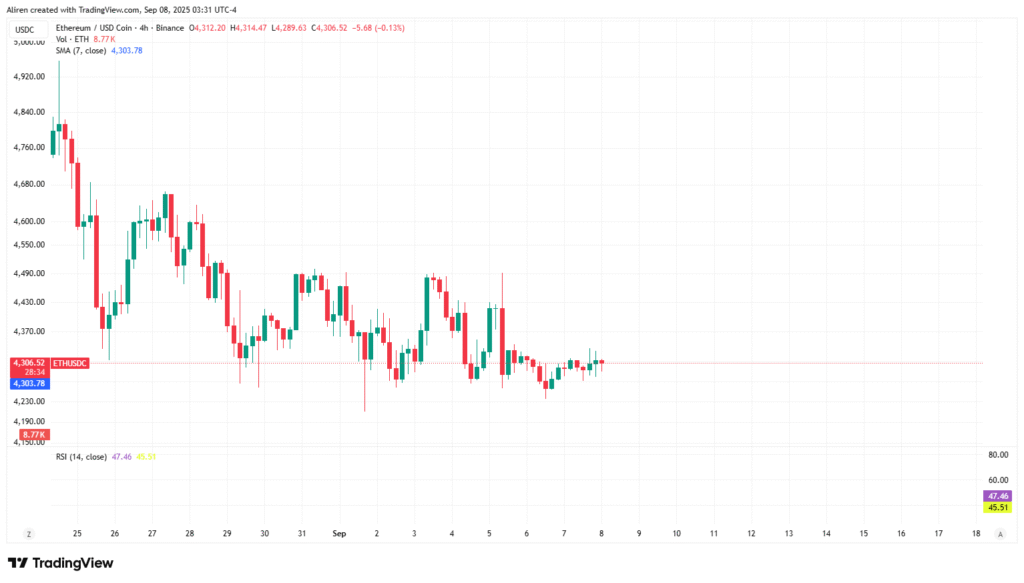
If ETH finds support around the lower consolidation boundary at $4,232 and closes above $4,488 daily, it could extend the rally toward its record high at $4,956. The RSI on the chart is hovering around its neutral level of 50, indicating indecisiveness among traders. However, if ETH faces a correction and closes below the lower consolidation level at $4,232, it could extend the decline to retest its 50-day EMA at $4,050.
Weekly Summary & Outlook
From August 31 to September 7, the US dollar exhibited sensitivity to weak economic signals, which boosted gold and kept crypto in a cautious consolidation. Disappointing NFP data and expectations of a rate cut set the tone, with Bitcoin testing key supports and Ethereum showing bullish potential from stablecoin inflows targeting $5,000. Although bearish patterns persist, emerging liquidity in crypto suggests possible positive shifts. The upcoming CPI report on September 10 and FOMC decisions will be crucial—a dovish outcome could spark a risk-on sentiment and lead to breakouts in volatile sectors, such as crypto. Overall, markets are poised for movement, striking a balance between caution and opportunities presented by on-chain and economic indicators.
With UltraTrader, trader smarter.