


Forex Market Analysis
Gold (XAU/USD)
Price Movement
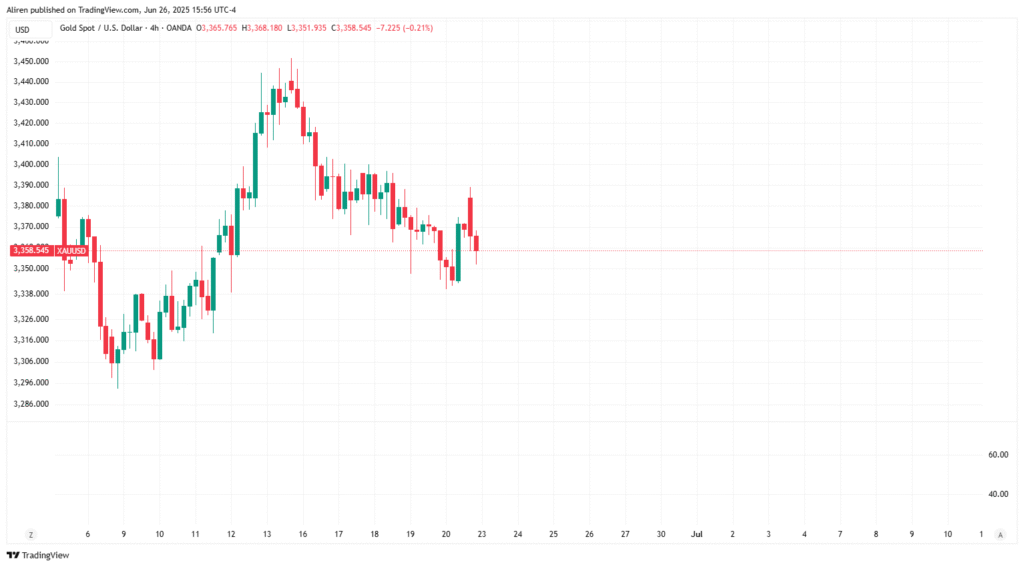
Gold (XAU/USD) traded near $3,370 on June 21, 2025, after breaking below $3,400 earlier in the week, driven by geopolitical tensions from the U.S. military action against Iran. As of June 22, 2025, at 03:16 PM EDT, gold remains around $3,370, reflecting safe-haven demand.
Fundamental Factors
- Geopolitical Tensions: The U.S. military action against Iran’s nuclear facilities on June 21, 2025, led by former President Trump, initially spiked safe-haven demand for gold. However, markets focused more on oil, limiting gold’s gains.
- Federal Reserve Policy: The Fed maintained interest rates at 4.25%–4.50% in June 2025, projecting two 25-basis-point cuts by year-end. Inflation at 2.40% in May 2025 and a hawkish Fed stance pressured gold, though rate cut expectations offered support.
Technical Analysis
- Price Levels: Gold is currently at approximately $3,370, with support at $3,323–$3,322 and $3,300. Resistance is at $3,374–$3,375, $3,400, and $3,500.
- Indicators: The RSI is at its lowest since February, indicating weak bullish momentum. Support at $2,530–$2,500 could be tested if $3,323 breaks, with resistance at $2,900 capping gains.
- Outlook: Bearish below $3,400, but geopolitical risks may trigger dip-buying.
Market Sentiment
Gold is under pressure from a stronger dollar and equities, but is supported by the Iran conflict. Its safe-haven appeal persists, though technical weaknesses suggest caution.
| Metric | Value |
|---|---|
| Current Price (June 22) | ~$3,370 |
| Support Levels | $3,323–$3,322, $3,300 |
| Resistance Levels | $3,374–$3,375, $3,400, $3,500 |
| RSI Status | Lowest since February |
US Dollar Index (DXY)
Price Movement
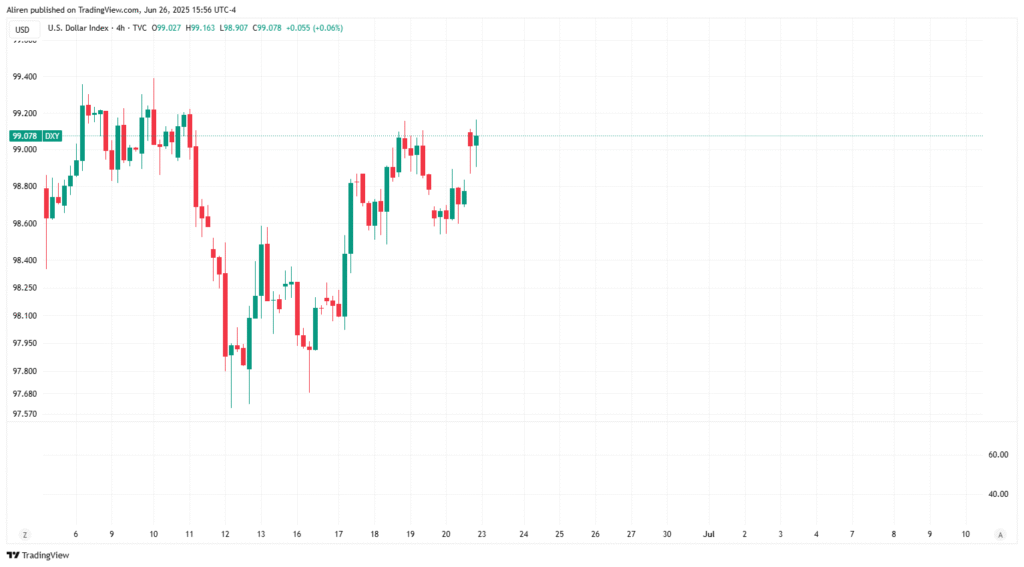
The DXY traded near 98.58–98.90 on June 21, 2025, after testing support at 97.70. On June 22, 2025, at 03:16 PM EDT, it remains around 98.90, reflecting safe-haven demand from the Iran conflict.
Fundamental Factors
- Geopolitical Developments: The U.S. military action against Iran on June 21, 2025, initially boosted the dollar as a safe-haven asset. Easing tensions shifted focus to oil, causing a slight retracement.
- Federal Reserve Stance: The Fed’s June 2025 decision to hold rates at 4.25%–4.50%, with 50 basis points of cuts projected by year-end, supported the dollar. Inflation at 2.40% in May reinforced a hawkish pause.
- Market Mood: Middle East tensions and Trump’s tariff threats fueled risk aversion, intermittently strengthening the dollar.
Technical Analysis
- Price Levels: DXY is near 98.90, with support at 97.70 and resistance at 98.90 and 99.418.
- Indicators: A bullish setup is forming, with the DXY poised for a breakout above 98.90. Failure to hold 97.70 could lead to further downside.
- Outlook: Bullish above 98.90, with potential to reach 99.418 if geopolitical risks persist.
Market Sentiment
The dollar gained from safe-haven flows during the Iran conflict but eased as tensions subsided. Its technical strength suggests resilience.
| Metric | Value |
|---|---|
| Current Price (June 22) | ~98.90 |
| Support Levels | 97.70 |
| Resistance Levels | 98.90, 99.418 |
| Technical Bias | Bullish above 98.90 |
Cryptocurrency Market Analysis
Bitcoin (BTC)
Price Movement
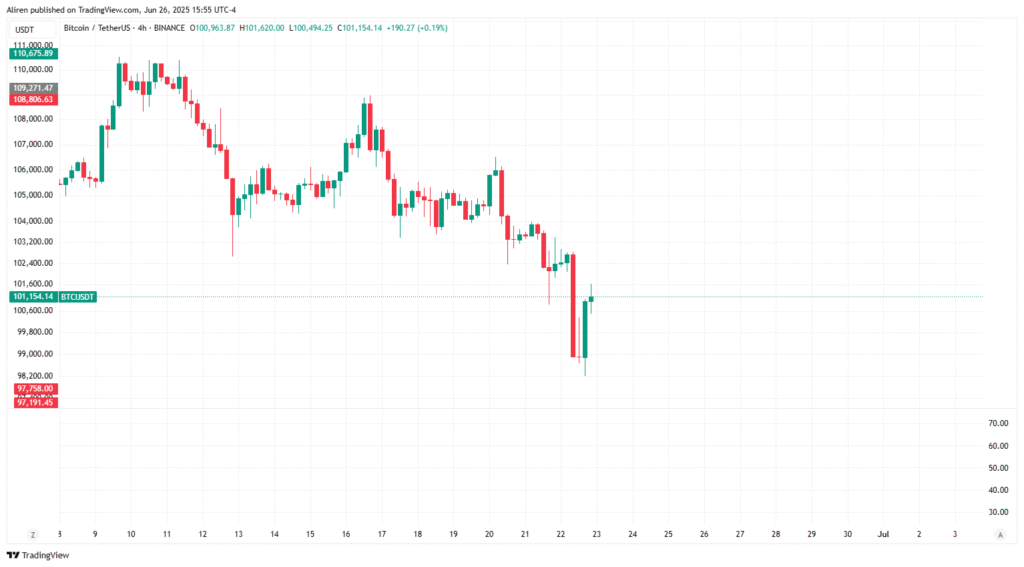
Bitcoin (BTC) plummeted to $101,095 on June 21, 2025, amid the Iran conflict and market volatility. As of June 22, 2025, at 03:16 PM EDT, BTC was being traded near 99,000$.
Fundamental Factors
- Geopolitical Impact: The U.S. military action against Iran on June 21, 2025, triggered risk-off sentiment, driving Bitcoin’s decline to $101,095 and further to ~$99,000 by June 22. Markets focused on oil, limiting broader crypto panic.
- Institutional Support: Despite volatility, spot Bitcoin ETF inflows provided some cushion, though retail sentiment turned bearish, as seen in social media commentary.
Technical Analysis
- Price Levels: Bitcoin is near $99,000, with support at $98,000 and resistance at $101,000 and $105,000. The $101,095 low on June 21 marked a key support test.
- Indicators: The RSI is at 47, below the neutral 50, indicating bearish momentum. A bearish MACD crossover reinforces the downward trend.
- Outlook: Bearish below $101,000, with a potential decline to $98,000 if support breaks. A recovery above $101,000 could target $105,000.
Market Sentiment
Bitcoin’s sharp drop reflects its correlation with risk assets and geopolitical shocks. While ETF inflows offer support, bearish retail sentiment dominates.
| Metric | Value |
|---|---|
| Low (June 21) | $101,095 |
| Current Price (June 22) | ~$99,000 |
| Support Levels | $98,000 |
| Resistance Levels | $101,000, $105,000 |
| RSI Status | 47 (bearish) |
Ethereum (ETH)
Price Movement
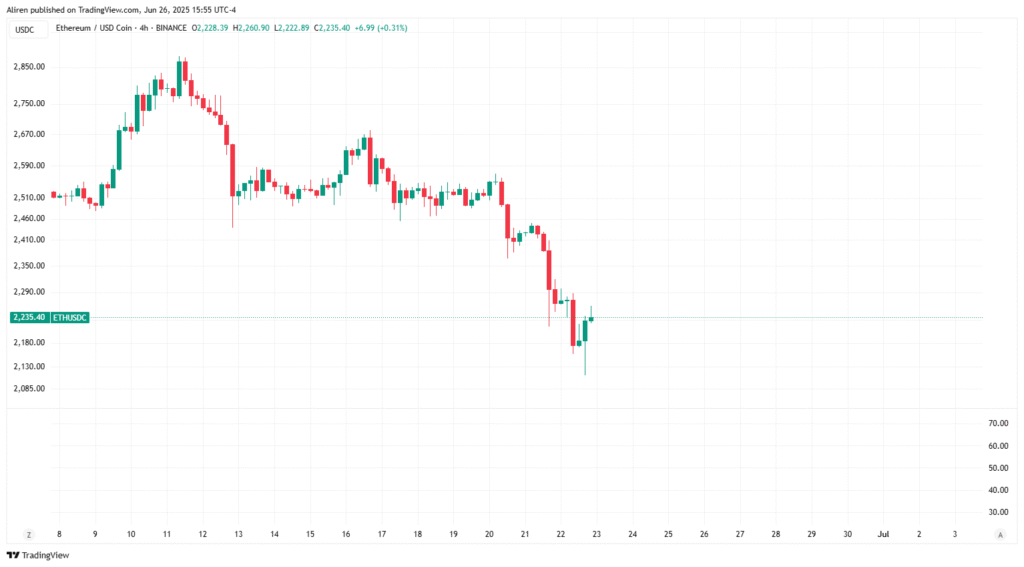
Ethereum (ETH) crashed to $2,222.81 on June 21, 2025, amid the Iran conflict, recovering to ~$2,300.50 by June 22, 2025, at 03:16 PM EDT. Earlier, ETH rebounded from the 200-day EMA at $2,477.
Fundamental Factors
- Geopolitical Pressure: The Iran conflict, which triggered a risk-off move on June 21, caused Ethereum’s flash crash. Steady ETF inflows supported its recovery.
- ETF Inflows: Ethereum spot ETFs recorded $3.9 billion in cumulative inflows, with BlackRock’s ETHA ETF at $5 billion, bolstering price resilience.
- Derivatives Market: Open Interest rose 5% to $37 billion on June 21, with $21 million in short liquidations, reflecting improving sentiment.
Technical Analysis
- Price Levels: ETH is currently at approximately $2,300.50, with support at $2,222 and resistance at $2,500. The $2,222.81 low marked a key support test.
- Indicators: High trading volume during the crash and a rising RSI suggest that buying interest is present at lower levels, although volatility remains high.
- Outlook: Bullish above $2,222, but failure to break $2,500 could retest support.
Market Sentiment
Ethereum’s crash was driven by geopolitical panic, but its recovery reflects the institutional strength of the cryptocurrency. The derivatives market signals cautious optimism.
| Metric | Value |
|---|---|
| Flash Crash Low (June 21) | $2,222.81 |
| Current Price (June 22) | ~$2,300.50 |
| Support Levels | $2,222 |
| Resistance Levels | $2,500 |
| Open Interest | $37 billion |
Other Relevant Market News
- U.S. Military Action Against Iran: On June 21, 2025, Trump’s reported strikes on Iran’s nuclear sites increased volatility across markets, boosting safe-haven assets like gold and the dollar while pressuring cryptocurrencies.
- Oil Market Reaction: WTI oil prices rose 2.7% last week, following a 13% rally, reflecting a stronger commodity response to the Iran conflict.
- Altcoin Movements: Solana (SOL) saw a minor uptick, with Open Interest at a weekly high, indicating selective crypto optimism.
Key Takeaways
Ethereum: Crashed to $2,222.81, recovered to ~$2,300.50, supported by ETF inflows.
Gold: Traded at ~$3,370, supported by the Iran conflict but pressured by a hawkish Fed and equities.
US Dollar Index: Near 98.90, bolstered by safe-haven demand on June 21, with a bullish bias above 98.90.
Bitcoin: Fell to $101,095 on June 21 and is now near $99,000 as of June 22, driven by geopolitical risk-off sentiment.