


The week of December 15–21 saw Bitcoin test support near $85,500 before rebounding to close near $88,000, while gold consolidated in the $4,300–$4,350 range at record highs. The DXY bounced mid-week slightly but remains structurally weak. Below are the key moves, levels, and trading setups for active traders using UltraTrader journals.
Macro Backdrop
The week opened with a focus on U.S. labor and inflation data. November nonfarm payrolls and CPI readings came in softer than expected, reinforcing market conviction that the Fed will continue easing into 2026. U.S. retail sales also disappointed, signaling weakening consumer demand. This backdrop kept Treasury yields depressed (10-year around 4.1%) and supported gold’s climb toward record highs while capping DXY upside.
Geopolitical headlines added support to safe-haven assets: U.S.–Venezuela oil tensions and comments from Putin on Ukraine elevated risk premia mid-week. By week’s end, most traders were in holiday mode, with volume declining and price action consolidating into the close.
DXY – US Dollar Index
Fundamentals
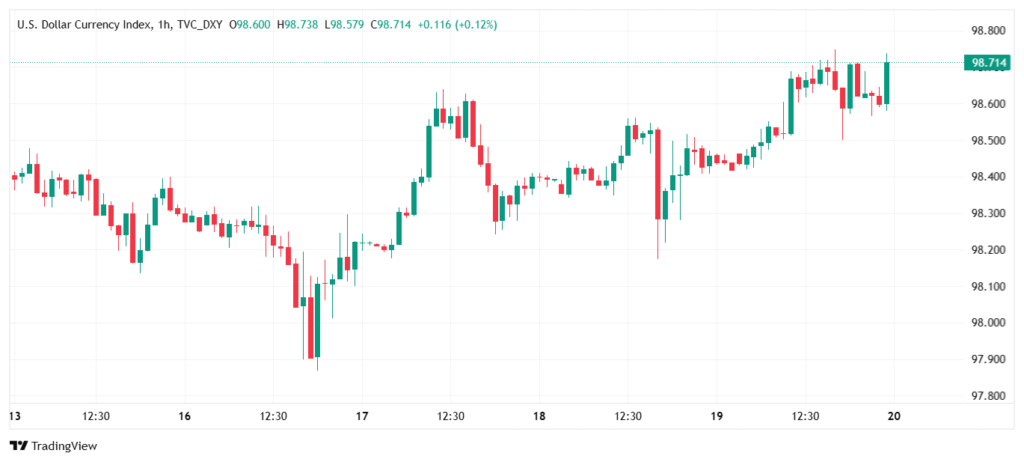
The DXY bounced to ~98.72 on December 19 after hitting lows near 97.50 earlier in the week. The rebound was modest and met with immediate selling. December’s weaker-than-expected CPI briefly supported the dollar, but the boost was short-lived as markets interpreted the data as giving the Fed room to cut further in 2026. Overall, the structural downtrend remains intact; the week was a sideways consolidation within the larger bearish trend.
Technical View
Key levels and price action this week:
- Resistance: 98.8–99.0 (tested mid-week, failed to break convincingly); then 100.0–100.4 above that.
- Support: 98.0 (held this week); 97.5 next; then 96.8–97.0 for extended downside.
- Current range: DXY spent most of the week in 97.5–98.7, a classic sideways consolidation within the larger downtrend.
Trading bias:
- Primary thesis remains sell rallies into 98.8–99.0, targeting 98.0 and then 97.5 on any push lower.
- A daily close back above 99.2 would signal a potential reversal of the post-Fed breakdown, but this remains a low-probability event without a major economic surprise or a Fed hawkish reversal.
Gold (XAU/USD)
Fundamentals
Gold remained near record highs throughout the week, consolidating in a tight $4,300–$4,350 range. The weaker dollar, soft U.S. data, and geopolitical headlines all provided support. A softer-than-expected CPI on December 18 briefly pulled gold lower as markets initially interpreted the print as reducing immediate Fed easing, but the pullback was shallow, and buyers quickly stepped in. By week’s close, gold hovered near $4,338–$4,347, up roughly 1% for the week.
Longer-term narratives remain intact: central bank diversification, persistent inflation fears, and geopolitical uncertainty all support sustained gold strength into 2026.
Technical View
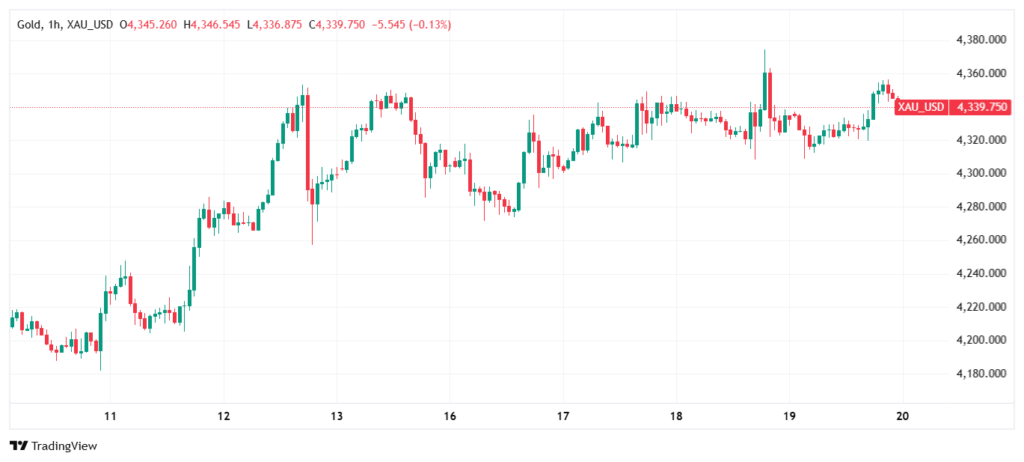
After last week’s breakout above $4,255, this week gold consolidated into range-bound trading:
- Resistance: 4,365 (near-term target from earlier analysis); 4,400–4,500 for medium-term projections.
- Support: 4,250 (breakout zone, holding as support); 4,200; and the 4,145 level flagged in technical forecasts as a deeper correction target if support breaks.
- Current price action: Oscillating between 4,305–4,355 all week, typical of overbought consolidation.
Trading bias:
- Pullback buyers: Any dip toward 4,250–4,200 is a buying opportunity for swing longs with targets 4,365–4,400.
- Range traders: Short near 4,350, cover near 4,310–4,315, repeat until a break above 4,365 or below 4,200 confirms the next directional move.
- Momentum readings remain overbought, so patience for a pullback or consolidation is warranted.
Bitcoin (BTC)
Fundamentals
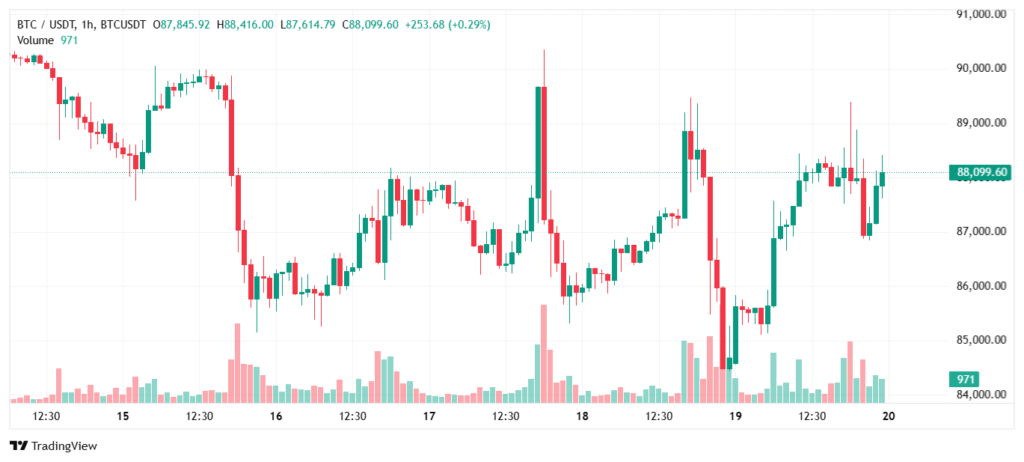
Bitcoin had a volatile week, opening near $88,200, diving to $85,450 by mid-week (December 19), then rebounding to close around $88,000 on December 21. The weakness was triggered by softer CPI data on December 18, which paradoxically caused profit-taking (markets may have been expecting stronger inflation, which would have justified higher crypto prices).
The rebound mid-to-late week suggests institutional buyers were defending the $85,500 region, consistent with the “cost basis” area (high-80ks to mid-80s) cited in prior weeks. December’s Fear & Greed Index remains at extreme fear (20 out of 100), historically a contrarian bullish signal.
Technical View
Weekly price action was volatile but ultimately constructive:
- Resistance: 90,000–91,000 (clear overhead); 94,000–94,300 (critical Fibonacci level from prior analysis).
- Support: The $85,500 low on December 19 was defended; prior analysis flagged high‑80k as a “cost basis” zone where institutional buyers tend to emerge.
- Weekly range: $85,450 to $90,060, a $4,600 swing that reflects choppy holiday sentiment and low conviction.
Trading bias:
- Base case: Consolidation in the $85,500–$90,000 range until early 2026. The failure to push above $90,000 suggests resistance remains formidable.
- Breakout plan: A daily close above 90,500 would target 94,000 again; a break above 94,300 opens the path to 100,000.
- Risk line: If the $85,500 low is decisively breached, the next support zone is $83,000–$84,000 (cost basis floor).
- The extreme fear reading (20) suggests another test lower may trigger panic sales before an eventual floor-and-bounce, but this is speculative.
Ethereum (ETH)
Fundamentals
ETH followed Bitcoin lower mid-week, trading into the $2,900–$2,950 range before rebounding to ~$2,977 by week’s end. Ethereum continues to move in Bitcoin’s shadow with less conviction and smaller ETF flows. The asset lacks headlines and stand-alone catalysts; its strength will hinge on whether Bitcoin stabilizes and recovers in the new year.
Technical View
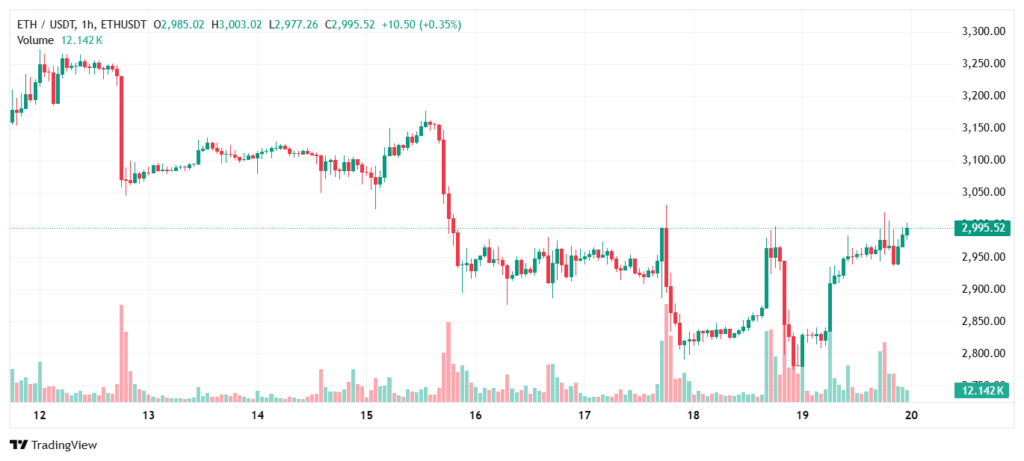
ETH breakdown and recovery mirrors BTC:
- Resistance: 3,000–3,050 (major psychological area and key technical level); 3,300–3,400 above that.
- Support: 2,950–2,977 (tested this week and held); 2,800–2,850 further down.
- Current range: Spent the week mostly in $2,950–$3,020, fighting to regain and hold the 3,000 psychological round number.
Trading bias:
- Short-term outlook: Recovery consolidation. ETH is more of a “follower” asset; strength requires Bitcoin to confirm stability above 90,000 first.
- Breakout plan: A daily close above $3,050 with volume would target $3,300–$3,400 and validate bullish setups. Conversely, sustained closes below $2,950 warn of a drop toward $2,700–$2,800.
- Position sizing: Trade ETH at 30–50% of Bitcoin position size, given lower conviction and tighter stops.
Summary
| Asset | Weekly Move | Key Resistance | Key Support | Trading Bias |
| DXY | +0.3% (bounced mid-week but failed) | 98.8–99.0, then 100+ | 98.0, then 97.5–96.8 | Consolidation; sell rallies into resistance |
| Gold | +1.0% (stayed near highs) | 4,365, then 4,400–4,500 | 4,250, then 4,200–4,145 | Bullish; buy pullbacks above 4,200 |
| BTC | -0.9% (volatile; dipped then recovered) | 90k–91k, then 94k–94.3k | 85.5k (defended), then 83k–84k | Range-bound; await breakout above 90.5k |
| ETH | -1.2% (tracked BTC lower/higher) | 3,050, then 3,300–3,400 | 2,977, then 2,800–2,850 | Recovery consolidation; follows BTC lead |
How To Apply This In UltraTrader
For your trading journal:
Macro regime tag: “Holiday week, low conviction, all assets consolidating amid soft US inflation data.” This helps filter trades by calendar seasonality and volatility regime.
Tag by setup: “BTC cost-basis defense (85.5k zone, week of Dec 15–21).” Later, review how often this setup leads to bounces vs. breakdowns.
Reference levels daily: “DXY short from 98.60 into 98.0,” “Gold swing long from 4,285 toward 4,360,” “BTC range trade 85.5k–90k,” “ETH waiting for 3,050 break.”