


Have you ever thought about how to ignore small price changes in the market and focus on the bigger trends? Moving Averages (MAs) help you do this.
Moving averages are one of the most critical tools in technical analysis due to their simplicity and ability to smooth price data for trend identification. In this article, you will learn how various moving averages work and discover strategies for using them in both bullish and bearish trend-following trading.
Moving averages (MAs) are traders’ most widely used technical analysis tools. Their simplicity and effectiveness in identifying trends make them a powerful indicator for trading decisions. In this article, we’ll explore the different types of moving averages, how they work, and various strategies for using them in trend-following trading strategies.
What is a Moving Average?
A moving average is a way to analyze data by averaging different parts of a complete set of data. In trading, this often means averaging the prices of a financial asset over a set number of time periods. This helps to smooth out price changes and gives a clearer view of the asset’s overall trend.
Moving averages can help identify trends, determine support and resistance levels, and signal when to buy or sell. However, they rely on past prices, so traders usually use them along with other tools like the Relative Strength Index (RSI) or Moving Average Convergence Divergence (MACD) for better analysis.
Why use moving averages in trading?
Moving averages are used primarily to identify trends, spot potential reversals, and confirm price momentum. Here are some of the key benefits:
- Trend identification: Moving averages help traders determine whether an asset is in an uptrend, a downtrend, or is moving sideways. For example, if a stock’s price is above its 200-day SMA, it is generally considered to be in an uptrend.
- Support and Resistance levels: Moving averages can act as dynamic support or resistance levels. Prices often “bounce” off moving averages, especially during strong trends. For instance, an FX pair in an uptrend may pull back and find support around its 50-day moving average before resuming its upward move. In contrast to a down-trending FX pair, the 50-day moving average tends to act as a resistance.
- Signal generation: Moving averages generate trading signals based on crossovers:
- Golden Cross: A bullish signal that occurs when a short-term moving average (e.g., 50-day) crosses above a long-term moving average (e.g., 200-day).
- Death Cross: A bearish signal that occurs when a short-term moving average crosses below a long-term moving average.
Types of Moving Averages
Moving averages analyze price data and have different types that weigh price changes in various ways. This affects their sensitivity to recent market movements. The four main types are: Simple Moving Average (SMA), Exponential Moving Average (EMA), Weighted Moving Average (WMA), and Smoothed Moving Average (SMMA).
Let’s dive into the details about each type and see how they are calculated:
1. Simple Moving Average (SMA)
The Simple Moving Average (SMA) is the most straightforward type of moving average, calculated by summing the closing prices of an asset over a specified number of periods and dividing by that number. It treats all data points equally, regardless of their recency, providing a clear and stable view of historical price trends.
Calculation:
To calculate the Simple Moving Average (SMA), you first need to add up the closing prices for the selected time period and then divide that total by the number of periods.
SMA = (P1 + P2 + … + Pn) / n
Where:
- P1 to Pn = Closing prices for each period
- n = Number of periods (e.g., 10 for a 10-day SMA)
Let’s assume that you want to calculate a 5-day Simple Moving Average (SMA) for Bitcoin. You should calculate the average closing price of the last 5 days and divide by 5. As new prices come in, drop the oldest price and recalculate the average, creating a “moving” line on the graph. You can use closing, high, low, or open prices based on your trading preferences.
2. Exponential Moving Average (EMA)
The Exponential Moving Average (EMA) improves on the SMA’s lag by assigning greater weight to recent prices, making it more responsive to current market conditions. The weighting decreases exponentially for older data, ensuring the EMA tracks price changes more closely.
Calculation:
The EMA is calculated using a recursive formula:
EMA_today = (Price_today × Multiplier) + (EMA_yesterday × (1 – Multiplier))
Where:
- Multiplier = 2 / (n + 1)
- n = Number of periods
- The first EMA typically uses an SMA as the starting value.
For example, for a 10-period EMA, the multiplier is 2 / (10 + 1) = 0.1818. If today’s price is $100 and yesterday’s EMA is $95, the new EMA is ($100 × 0.1818) + ($95 × 0.8182) ≈ $95.91. This process repeats with each new price, giving more weight to recent data. Like the SMA, the EMA can be based on closing, high, low, or open prices.
3. Weighted Moving Average (WMA)
The Weighted Moving Average (WMA) focuses more on recent price data by giving it greater importance than older prices. WMA combines the stability of the Simple Moving Average (SMA) with the quick response of the Exponential Moving Average (EMA).
Calculation:
The WMA is calculated as:
WMA = (n × P1 + (n-1) × P2 + … + 1 × Pn) / (n(n+1)/2)
Where:
- P1 = Most recent price
- Pn = Oldest price
- n = Number of periods
For a 5-period WMA, the most recent price is multiplied by 5, the second by 4, down to 1, and the sum is divided by (5 × 6) / 2 = 15. For example, if the last five prices of AUD/USD are $0.70, $0.69, $0.68, $0.67, $0.66, the WMA is [(5 × 0.70) + (4 × 0.69) + (3 × 0.68) + (2 × 0.67) + (1 × 0.66)] / 15 ≈ $0.6867. The result is plotted as a moving line.
4. Smoothed Moving Average (SMMA)
The Smoothed Moving Average (SMMA), often called Wilder’s Moving Average, is a variation of the EMA with heavier smoothing, designed to minimize noise and focus on long-term trends. It’s frequently used in indicators like the Average Directional Index (ADX).
Calculation:
SMMA_today = (SMMA_yesterday × (n-1) + Price_today) / n
Where:
- n = Number of periods
For example, a 14-period SMMA takes the previous SMMA, multiplies it by 13, adds today’s price, and divides by 14. The first SMMA often starts with an SMA. This heavy smoothing reduces the impact of recent price changes.
Combining Moving Averages with Other Indicators
Moving averages help you identify trends, and combining them with other technical indicators improves the accuracy of analysis. When you use moving averages alongside other indicators, you’ll be able to reduce false signals and clarify market conditions.
Using various indicators allows for trend validation, momentum assessment, volatility checks, and detection of overbought or oversold levels. Below, we highlight key indicators to use with moving averages and their benefits for Forex and crypto trading.
1. Relative Strength Index (RSI) with Moving Averages
The Relative Strength Index (RSI) helps traders identify price trends, ranging from 0 to 100. It shows if an asset is overbought (above 70) or oversold (below 30).
When combined with moving averages (MAs), the RSI filters out weak trends. For a buy signal, look for a crossover of the 50-day simple moving average (SMA) and ensure the RSI is below 30, indicating it’s oversold and the trend is upward.
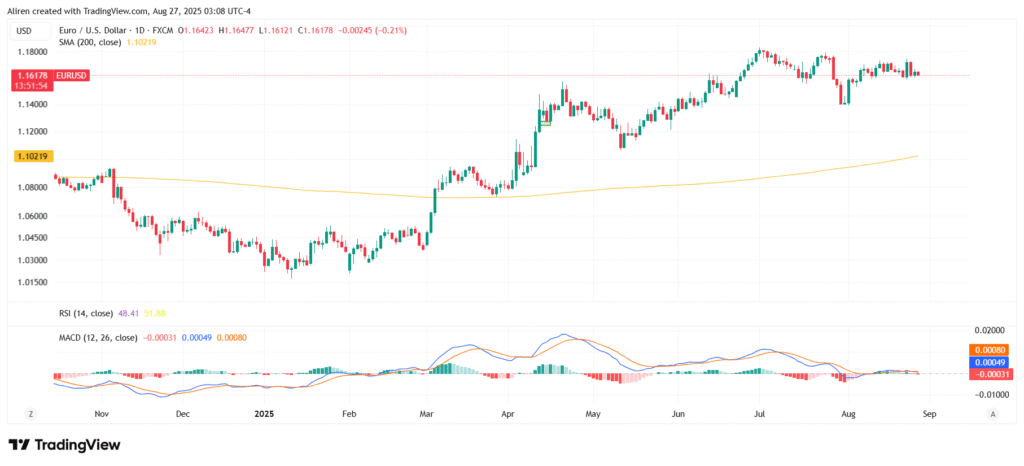
For instance, on the EUR/USD pair, if the price crosses above the 50-day SMA and the RSI is below 30, it signals a strong buying opportunity.
2. Moving Average Convergence Divergence (MACD) with Moving Averages
The MACD indicator utilizes the 12-period and 26-period EMAs to assess momentum and shifts in trend, incorporating a signal line (which is the 9-period EMA of the MACD) and a histogram.
Combining MACD with a 200-day SMA confirms trends; prices above the SMA indicate an upward trend. Monitor MACD crossovers to determine entry points: when the MACD line crosses above the signal line during an uptrend, it indicates bullish momentum. Additionally, pay attention to divergences, such as instances where prices achieve new highs while the MACD does not, as this may indicate a potential trend reversal.
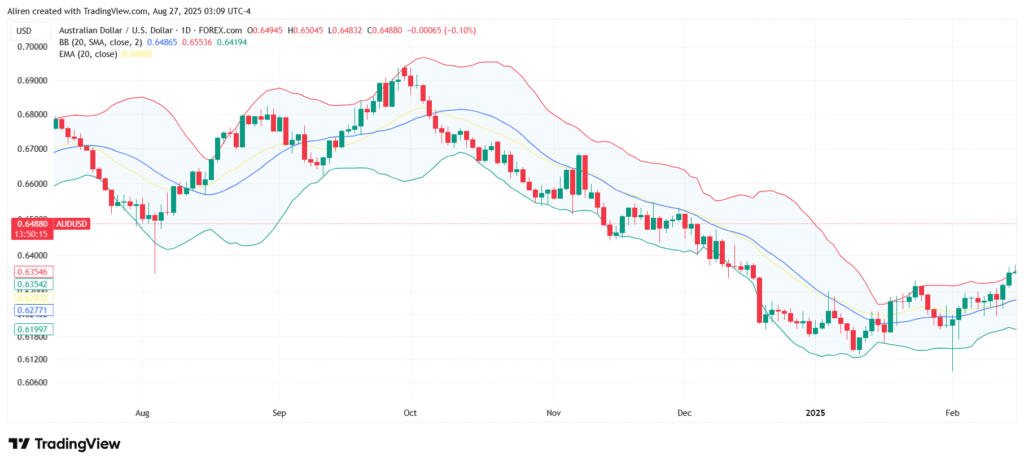
3. Bollinger Bands with Moving Averages
Bollinger Bands use a 20-period simple moving average (SMA) as the middle line, with upper and lower lines set at two standard deviations to measure market volatility. You can combine this with a 10-period exponential moving average (EMA) for trading strategies. The SMA serves as the centerline, and when the 10-period EMA crosses it, it indicates momentum. During low volatility, look for a breakout confirmed by the EMA crossing a 50-day SMA. For example, if AUD/USD breaks above the upper band and the EMA crosses the SMA, it signals a strong uptrend linked to rising commodity prices.
4. Average Directional Index (ADX) with Moving Averages
ADX measures trend strength on a 0-100 scale (above 25 = strong trend). Pair it with MAs to validate trend signals: Use an SMA or EMA to identify direction, then check ADX for strength. For example, a 50-day SMA crossover signaling a buy is stronger if ADX > 25. ADX’s +DI and -DI lines also confirm MA direction (+DI above -DI = uptrend).
5. Stochastic Oscillator with Moving Averages
The Stochastic Oscillator compares closing prices to a price range over 14 periods, identifying overbought (>80) or oversold (<20) levels. Combine with MAs for momentum confirmation: Use an MA crossover for trend signals, then Stochastic crossovers (e.g., %K above %D below 20) for entries. For example, in an uptrend with a 200-day SMA, a Stochastic buy signal in oversold territory confirms pullback entries.
Moving Average Trading Strategies
MAs power a range of strategies, from simple crossovers to complex ribbons, tailored for Forex and crypto. Below are five key strategies inspired by proven techniques, with steps and examples.
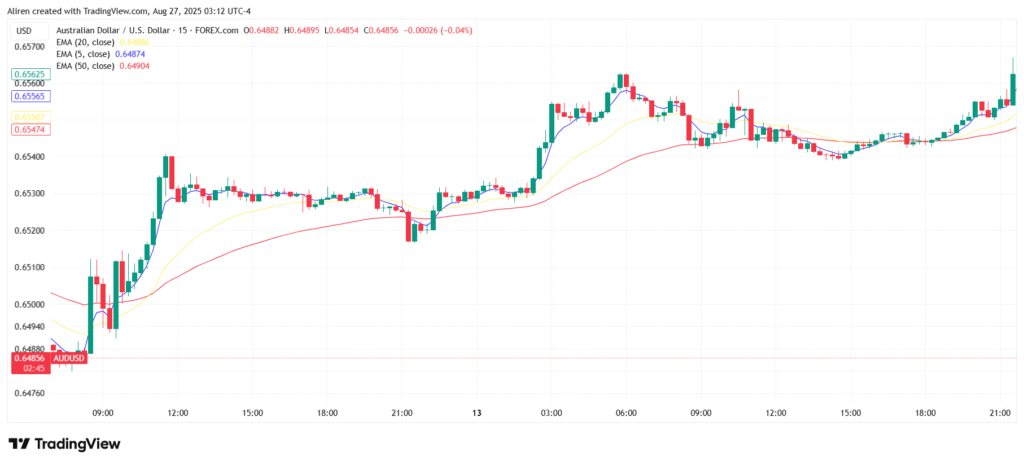
1. Moving Average Crossover Strategy
This strategy uses EMA crossovers to catch trends, leveraging their responsiveness. It’s ideal for trending markets.
Steps:
- Plot a 5-period EMA, 20-period EMA, and 50-period EMA on a 15-minute chart.
- Buy: When the 5-period EMA crosses above the 20-period EMA, and both EMAs and price are above the 50-period EMA.
- Sell: When the 5-period EMA crosses below the 20-period EMA, and both EMAs and price are below the 50-period EMA.
- Place a stop-loss below the 20-period EMA (buy) or 10 pips from entry. For sells, place it above the 20-period EMA or 10 pips.
- Optional: Move stop-loss to break-even at 10 pips profit.
- Exit with a 20-pip target or when the 5-period EMA crosses back (below for buys, above for sells).
2. Moving Average Envelopes Strategy
Envelopes set percentage bands around an MA to trade pullbacks or breakouts in trending markets.
Steps:
- Plot a 20-period SMA with 0.05% envelopes (upper/lower bands) on a 1-minute chart for day trading. Adjust percentages (1-10% for daily charts) based on volatility.
- In an uptrend (price above SMA), buy when the price touches the middle band (SMA) and rallies. In a downtrend, sell when the price hits the middle band and drops.
- Place a stop-loss one pip below the recent swing low (buy) or above the swing high (sell).
- Exit at the opposite band (lower for sells, upper for buys) or set a target twice the risk (e.g., risk five pips, target 10 pips).
3. Moving Average Ribbon Strategy
The ribbon uses multiple EMAs to gauge trend strength and catch breakouts after consolidation.
Steps:
- Plot 8-15 EMAs (e.g., 5, 8, 10, 13, 15, 20, 30, 50 periods) on a daily chart.
- Watch for convergence (MAs forming a tight line during a sideways range), indicating low volatility.
- Place a buy order above the range’s high and a sell order below the low.
- If the buy order triggers, set a stop-loss below the range’s low; for sells, above the high.
- Exit when the ribbon fans out (MAs separate), signaling trend strength fading, or use a fixed pip target.
4. MACD with Moving Average Strategy
This combines MACD (12-period and 26-period EMA difference, with a 9-period signal line) with an MA for trend confirmation.
Steps:
- Plot MACD and a 50-period SMA on a daily chart.
- In an uptrend (price above 50-SMA, MACD above zero), buy when MACD crosses above the signal line. In a downtrend (price below 50-SMA, MACD below zero), sell when MACD crosses below the signal line.
- Set a stop-loss below the recent swing low (buy) or above the swing high (sell).
- Exit when MACD crosses back (below for buys, above for sells) or at a fixed pip target.
5. Guppy Multiple Moving Average (GMMA) Strategy
The GMMA uses two EMA sets (short-term: 3, 5, 8, 10, 12, 15; long-term: 30, 35, 40, 45, 50, 60) to assess trader sentiment and trend shifts.
Steps:
- Plot short-term (e.g., green) and long-term (e.g., red) EMAs on a daily chart.
- Buy when short-term EMAs cross above long-term EMAs, signaling short-term trader strength. Sell when short-term EMAs cross below.
- If short-term EMAs don’t cross long-term ones, it may indicate a weakening trend.
- Set stop-losses below recent lows (buys) or above highs (sells). Exit when short-term EMAs reverse or the trend weakens.
Advanced Strategies and Best Practices
To maximize MA effectiveness:
- Optimize Periods: Test MA lengths (e.g., 10, 50, 200) for your market and timeframe to find the best fit.
- Trend Confirmation: Use ADX >25 to filter crossover signals, ensuring trades align with strong trends in Forex or crypto.
- Risk Management: Set stop-losses below MAs or recent swings and aim for 1:2 risk-reward ratios. Backtest strategies on platforms like TradingView or Binance to validate performance.
- Keep a Trading Journal: Record every trade, including entry/exit points, MA settings, indicators used, and outcomes. Review your trading journal regularly to spot patterns, refine strategies, and improve decision-making.
- Market Context: In Forex, align with economic calendars (e.g., non-farm payrolls for USD pairs). In crypto, monitor X sentiment for sudden volatility shifts, like those driven by news or whale activity.
Advantages and Disadvantages of Moving Averages
Advantages:
- Clear Trend Visualization: MAs simplify complex price data, making it easier to identify bullish or bearish trends.
- Flexible Across Strategies: From scalping to long-term investing, MAs adapt to various timeframes and markets, supporting strategies like crossovers or envelopes.
- Dynamic Market Levels: They act as moving support or resistance, helping traders spot entry or exit points, such as the 200-day SMA holding as support in Bitcoin’s 2023 uptrend.
- Enhances Decision-Making: When combined with indicators like RSI or Bollinger Bands, MAs provide robust signals, improving trade timing in volatile markets.
- User-Friendly: Easy to set up and interpret, even for beginners.
Disadvantages:
- Delayed Signals: As lagging indicators, MAs rely on historical data, which can delay responses to rapid price shifts, especially in crypto’s fast-moving markets.
- Weak in Sideways Markets: In choppy or ranging conditions, like Ethereum’s 2022 consolidation, MAs can generate false signals, leading to losses.
- Overreliance Risk: Used alone, MAs lack predictive power and may mislead without context from fundamentals (e.g., Fed rate hikes for Forex) or other indicators.
- Parameter Sensitivity: Results vary based on period length or MA type, requiring testing to avoid suboptimal signals in different market conditions.
Bottom line
Moving averages are helpful tools for navigating Forex and crypto trading. Use the simple moving average (SMA) for long-term trends and the exponential moving average (EMA) for quick trades. The weighted moving average (WMA) and smoothed moving average (SMMA) provide balanced views.
Combining moving averages with indicators like the Relative Strength Index (RSI) or Bollinger Bands can improve accuracy and reduce risks. No indicator is perfect, so also consider factors like interest rates for Forex or blockchain updates for crypto. Practice your strategies on demo accounts.
Understanding moving averages can provide valuable market insights, whether you’re making quick trades or long-term investments. Happy trading!