


In the world of financial markets, technical analysis empowers investors and traders to make more informed decisions, and Bollinger Bands are among its most valuable tools. Bollinger Bands is a powerful indicator created by financial expert John Bollinger in the 1980s. This indicator was developed to help understand and respond to the growing volatility of markets. Unlike fixed channels that draw straight lines from a moving average, Bollinger Bands adjust automatically to market changes.

John Bollinger developed a method that combined technical and fundamental analysis into a single approach, which he called ‘Rational Analysis.’ At that time, he was trading options and focusing on volatility. Traders used fixed-width trading bands, but Mr. Bollinger’s innovation was to make these bands changeable by using the standard deviation of volatility.
In this guide, you will learn how to use Bollinger Bands in any market, including stocks, forex, and cryptocurrencies. You will learn how to avoid common mistakes that many beginners often make. You will also master effective Bollinger Band trading strategies and adjust your settings for the best results based on your trading style.
In this article, we will share advanced techniques and detailed approaches that can improve your trading. Let’s get started.
The Theoretical Foundation
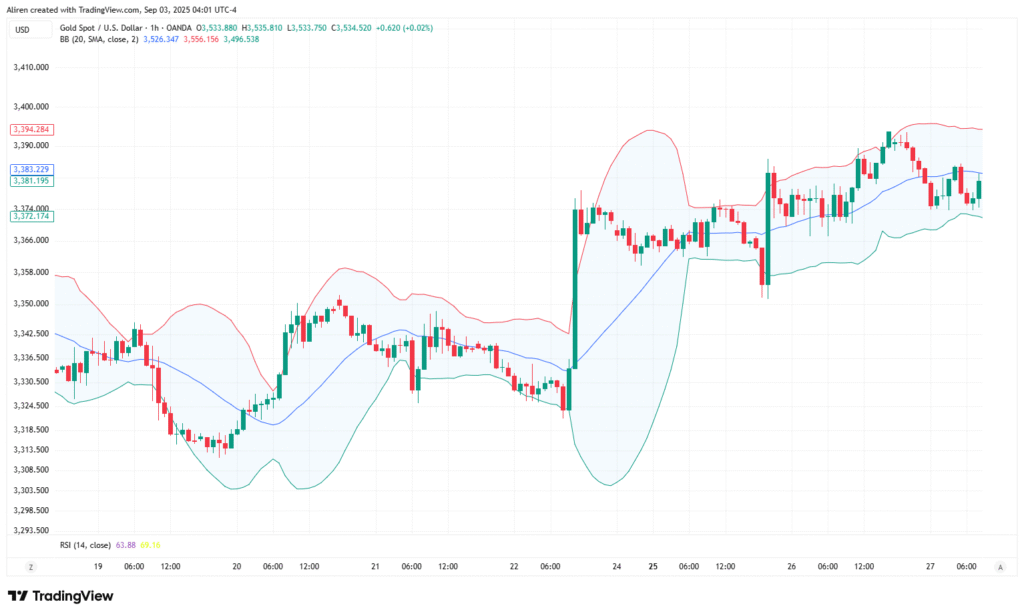
To use Bollinger Bands effectively, you must first understand the mathematics and the statistical principles upon which they are built. The indicator is composed of three primary lines: the middle band and the upper and lower bands.
The Middle Band: The Dynamic Mean
The primary component of the indicator is the middle band, typically a 20-period Simple Moving Average (SMA). This line shows the average price over the last 20 periods and serves as a dynamic average. In finance, the concept of mean reversion suggests that prices tend to revert to their average over time. The middle band acts as a constantly updating point that the price usually moves towards.
While the 20-period SMA is standard, traders can adjust it. A shorter period, such as 10, makes the bands respond more quickly to recent price changes, while a more extended period, like 50, smooths out the data and reduces noise from short-term fluctuations. The SMA is preferred over the Exponential Moving Average (EMA) for this indicator because it treats all prices in the period equally, making the standard deviation calculation a better reflection of overall price movements.
The Upper and Lower Bands: The Measure of Volatility
Bollinger Bands are envelopes that define the limits of price movement. They are set two standard deviations above and below the middle line, called the middle band. Standard deviation measures how much data points differ from the average. In finance, it shows volatility or risk.
For example, think about a class of students taking a test. If most students score between 70% and 75%, the standard deviation is low because the scores are relatively close to one another. If the scores range from 10% to 100%, the standard deviation is high since the scores are spread out. Bollinger Bands use this idea with price data.
High volatility means prices are spread out from the average, resulting in wider bands. Low volatility means prices are close to the average, resulting in narrower price fluctuations. This changing nature is what makes Bollinger Bands superior to fixed-price channels.
In a normal distribution, about 95% of data points fall within two standard deviations of the average. Therefore, when a price moves outside the bands, it’s significant and likely indicates a big price move or the start of a new trend.
The formulas for Bollinger Bands are:
– Middle Band: SMA(n)
– Upper Band: SMA(n) + k * σ(n)
– Lower Band: SMA(n) – k * σ(n)
Where:
– SMA(n) is the Simple Moving Average over n periods (usually 20).
– σ(n) is the Standard Deviation over n periods.
– k is the number of standard deviations (typically 2).
Decoding Price Action – A Comprehensive Guide to Interpretation
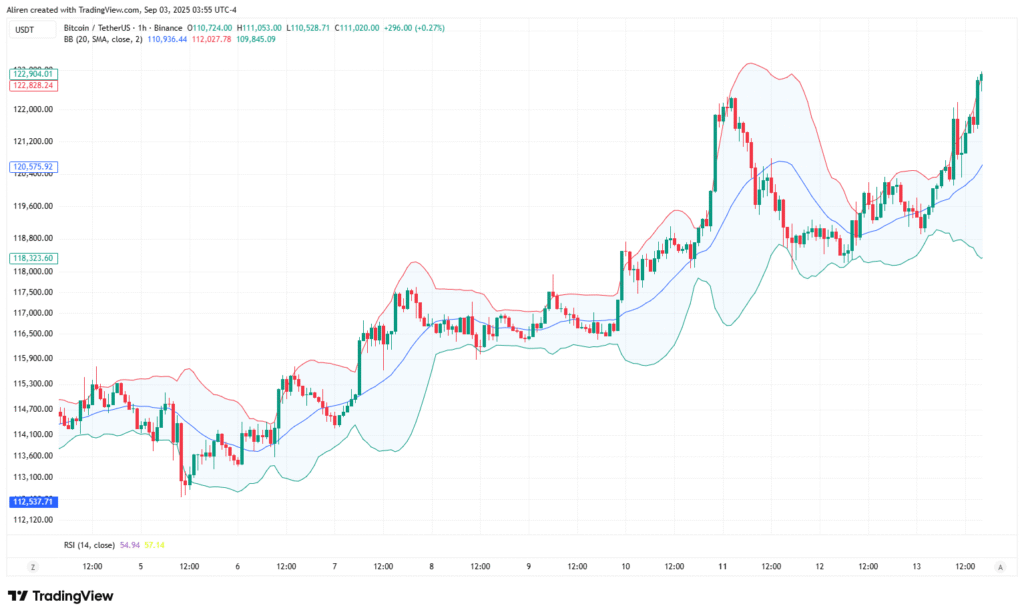
To give you a general idea about how Bollinger bands work, as we explained before, they consist of two lines plotted away from a simple moving average: an upper band and a lower band. When the market is volatile, these bands widen, and during calmer periods, they narrow. By examining Bollinger Bands, traders and investors can gain a better understanding of potential market movements.
When an asset’s price is close to the upper Bollinger Band, it is considered overbought and may decline in price. On the other hand, when the price is near the lower Bollinger Band, it is viewed as oversold and may rise. This information can help traders make decisions on when to enter or exit trades.
The Bollinger Squeeze: The Calm Before the Storm
This signal is significant and highly anticipated. When the bands come together to their tightest point, it shows a time of very low volatility and price stability. The market is uncertain, and trading volume is low as it builds up energy. This “squeeze” often happens before a big breakout and a strong price movement. You can think of it like a coiled spring: energy is building up, and once the pressure is released, a decisive move will happen. The squeeze itself does not indicate the direction, only that a significant move is likely.
Reversion to the Mean: The Law of Averages
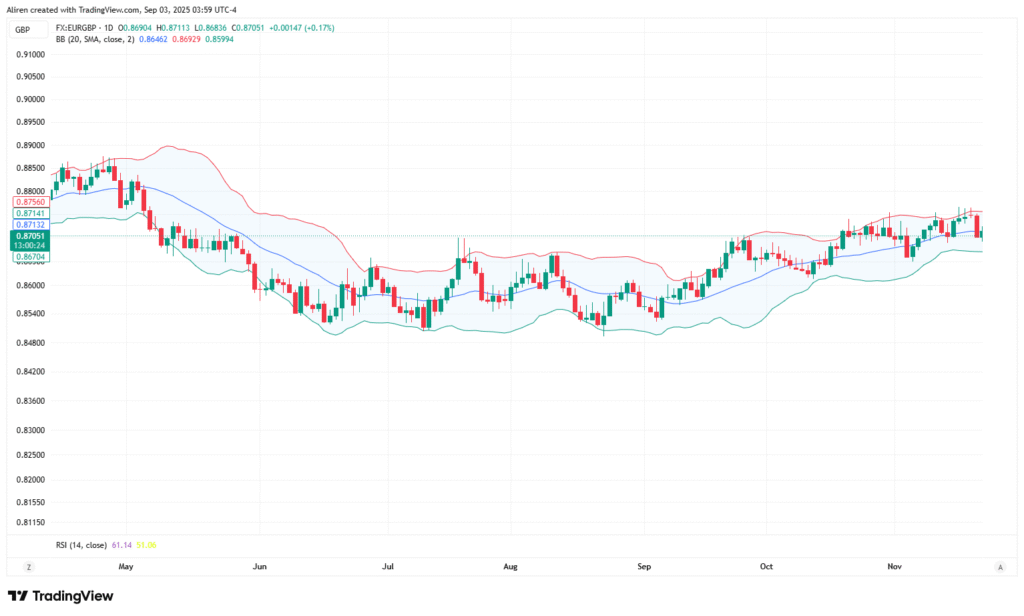
The principle of mean reversion is a powerful trading philosophy. In a non-trending (sideways) market, the price tends to oscillate between the upper and lower bands, eventually returning to the middle band. The bands act as dynamic support and resistance levels.
- A price touching the lower band suggests a temporary oversold condition.
- A price touching the upper band suggests a temporary overbought condition.
This strategy is effective in markets that are not undergoing a strong directional trend.
“Walking the Band”: The Sign of a Strong Trend
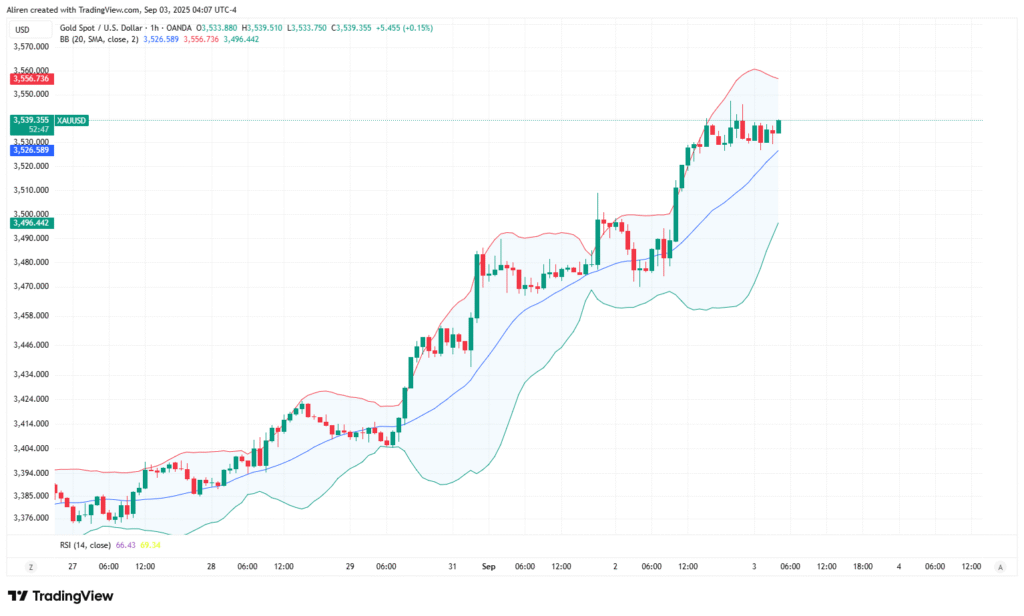
In a powerful, trending market, the price will defy the principle of mean reversion. Instead, it will “walk” along the upper or lower band. This signifies a momentum-driven market with consistent strength.
- In a strong uptrend, the price will consistently touch or stay close to the upper band, with the middle band acting as a dynamic support level.
- In a strong downtrend, the price will ride along the lower band, with the middle band acting as a dynamic resistance level.
A break back inside the bands can be an early signal that the trend is losing momentum or potentially reversing.
M-Tops and W-Bottoms: Classic Reversal Patterns
These are advanced patterns that Bollinger Bands help identify. They are based on the psychological phenomenon of momentum failure.
- An M-Top forms when a high is made outside the upper band, followed by a second, lower high made inside the band. This indicates a loss of buying momentum and a failed attempt to re-establish the trend.
- A W-Bottom is the inverse: a low is made outside the lower band, but a subsequent low is made inside the band. This suggests that sellers were unable to push the price to an even higher extreme.
Bollinger Bands and Candlestick Patterns
Combining Bollinger Bands with specific candlestick patterns provides high-conviction signals. For example, a bullish engulfing pattern that appears when the price touches the lower band, or a shooting star that appears at the upper band, provides strong confirmation of a potential reversal.
Expanding Bollinger Bands
Widening bands indicate that price volatility is increasing. This means that price changes are more noticeable than they have been in recent times. Economic news, earnings reports, geopolitical events, or sudden changes in market sentiment can cause this volatility. Traders often view increased volatility as an opportunity to make significant profits, but it also comes with a higher risk of incurring larger losses.
When the bands widen after a period of tightness, often referred to as a “squeeze,” many traders believe a breakout may occur. Although the bands do not indicate the direction the price will move, investors can assess potential movement by examining price trends in relation to the bands and utilizing other indicators.
Increased volatility from widening Bollinger Bands may prompt investors to reassess their risk management strategies. They might reduce their positions or diversify their investments more effectively better to handle the increased risk from larger price swings.
Practical Trading Strategies – Step-by-Step Implementation
Bollinger Bands are not a crystal ball. They are a tool for creating high-probability trading strategies.
Strategy 1: The Squeeze Breakout
This is a powerful, trend-following strategy.
- Identification: Spot a squeeze where the bands are at their narrowest point in recent history.
- Entry: Wait for a large, conviction-driven candle to close decisively outside the bands. Enter on the close of this candle.
- Confirmation: A genuine breakout is often accompanied by a volume spike. Look for an increase in volume to validate the move.
- Stop-Loss: Place a stop-loss order just outside the opposite band.
- Profit Target: Manage the trade by using the middle band as a dynamic trailing stop.
Strategy 2: The Reversion Strategy
This strategy is best suited for range-bound or consolidating markets.
- Buy Signal: When the price touches the lower band, buy on a confirming candle (e.g., a bullish hammer). Your profit target is the middle band.
- Sell Signal: When the price touches the upper band, sell on a confirming candle (e.g., a shooting star). Your profit target is the middle band.
Strategy 3: The Trend-Following Strategy
This is an excellent way to enter a trend already in motion.
- In an uptrend, wait for a pullback to the middle band. The middle band now acts as dynamic support. A touch of the middle band followed by a bullish confirmation candle provides an excellent entry point.
- In a downtrend, a pullback to the middle band can be a great entry point for a short position.
Strategy 4: The Double Bollinger Bands (Advanced)
This advanced technique uses two sets of Bollinger Bands on the same chart: one with a standard deviation of 1 and one with a standard deviation of 2.
- The bands with a standard deviation of 1 are your “trading bands,” used to identify high-probability entries.
- The bands with a standard deviation of 2 are used to identify strong trends and extreme conditions.
A signal to enter a trend occurs when the price moves outside the 1-standard deviation band, and a strong trend is confirmed when it moves into the zone between the 1- and 2-standard deviation bands.
The Art of Synergy – Combining for Confluence
No single indicator is perfect. Bollinger Bands are most potent when used to confirm signals from other tools, a concept known as confluence.
- Bollinger Bands + RSI: Bollinger Bands measure price volatility relative to a moving average, while the Relative Strength Index (RSI) measures momentum and overbought/oversold conditions. A strong reversal signal occurs when the price touches the lower band and the RSI simultaneously falls into the oversold region (below 30).
- Bollinger Bands + Volume: Volume is the ultimate validator. A breakout from a squeeze on high volume is a much more reliable signal than a breakout on low volume, as it confirms firm institutional conviction behind the move.
- Bollinger Bands and Fibonacci Retracements: This is a powerful and advanced combination. A high-probability reversal zone is created when a Fibonacci retracement level (e.g., 50% or 61.8%) lines up perfectly with a Bollinger Band touch.
Common Pitfalls and Expert-Level Tips
Even with the proper knowledge, mistakes are common. Here’s how to avoid them.
- Ignoring the Context: The most common mistake is using Bollinger Bands in isolation. A touch of the upper band in a strong uptrend is a sign of strength, not a sell signal.
- The Timeframe Puzzle: A signal on one timeframe can be noise on another. A reversal signal on a 5-minute chart might be a minor pullback on a daily chart. Always use multi-timeframe analysis to confirm your signals.
- Avoiding False Breakouts: A breakout is not confirmed until a candle closes decisively outside the bands. Don’t enter a trade on a mere touch.
- Parameter Customization: While the 20/2 setting is a great starting point, different assets and timeframes may require different settings. Backtest to find what works for your specific trading strategy.
- Risk Management: No indicator, no matter how powerful, is 100% accurate. Always use proper risk management and set a stop-loss to protect your capital.
- Trading Journal: Keeping a journal of each and every trade helps traders avoid repetitive mistakes and identify their strengths and weaknesses. You can use UltraTrader’s trading journal to auto-import your trades and get accurate data about your trades.
You can download UltraTrader’s mobile version from the following links:
Bottom line
Bollinger Bands are more than just a basic tool; they offer a detailed view of market volatility. When you understand how they work, you can use them to spot times of market calm, predict strong price moves, and confirm trends. Mastering Bollinger Bands involves developing a keen sense of how the market behaves, rather than simply following a set of rules. This guide provides the essential knowledge you need to begin learning about Bollinger Bands.