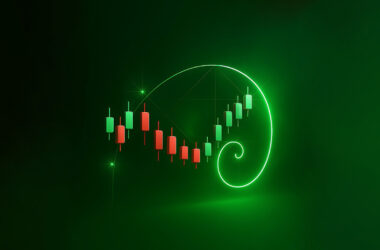


When you first fire up a trading platform and pull up a price chart, it might look like a chaotic mess of red and green bars. Those are candlestick charts, and trust me, they’re not as scary as they seem. They’re like the market’s secret language, the epic story of the sellers and the buyers’ war, and once you learn to read them, you’ll feel like a pro. This guide is your easy roadmap to understanding candlesticks—step by step, with no fancy jargon.
What Are Candlesticks, Anyway?
Candlesticks are like snapshots of price action for a specific chunk of time—it could be a minute, an hour, or a whole day. Each one spills the tea on four things: where the price kicked off, where it ended, the highest it climbed, and the lowest it tanked. That’s it. With just one glance, you can tell who’s running the show: buyers (bulls) or sellers (bears).
A Quick History Lesson
Back in the 1700s, Japanese rice traders started using candlesticks to track prices. A trading legend named Munehisa Homma basically invented the system. Fast-forward to the 1990s, and the West caught on, making candlesticks a global trading staple.
Why Candlestick Charts Are a Big Deal?
Unlike boring line charts, candlesticks pack a ton of info into one glance. They show the tug-of-war between bulls and bears in real time. Spot the right candlestick; you might catch a trend starting, stalling, or flipping entirely.
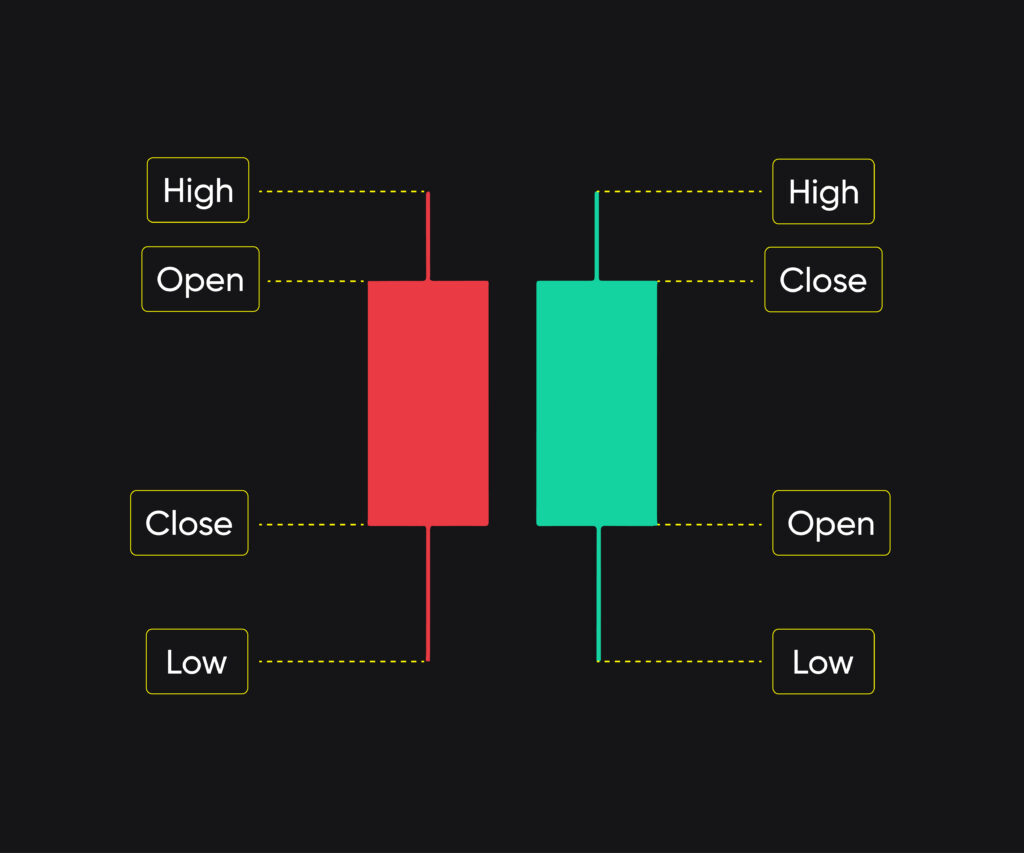
Anatomy of a Candlestick
Let’s break it down:
- Body: The chunky part. Shows where the price started and ended.
- Wicks (or shadows): Those skinny lines sticking out top and bottom. They mark the highest and lowest prices.
- Color: Green (or white) means the price increased—buyers won. Red (or black) means it dropped—sellers took over.
A green candle closing higher than it opened? Buyers are flexing. Is a red candle closing lower? Sellers are calling the shots.
Bullish vs. Bearish Candles
Candles come in two vibes:
- Bullish: Price closes higher than it opened (usually green). Buyers are pumped.
- Bearish: Price closes lower (usually red). Sellers are throwing punches.
A bullish candle in an uptrend screams confidence. A bearish one at the peak of an uptrend? There might be trouble brewing.
Timeframes: What’s One Candle Telling You?
Each candle covers a specific time—it could be 1 minute, 1 hour, or 1 day. On a daily chart, one candle = one day’s drama. On a 5-minute chart, it’s just five minutes of action. Switch timeframes to zoom in for quick trades or zoom out for the big picture.
Short timeframes (15-minute, 4-hour) are wild and fast, perfect for day traders. Longer ones (daily, weekly) are chill and show the actual trends.
Single Candlestick Patterns to Know
Some candles are like neon signs flashing what’s coming next. Here’s the lineup:
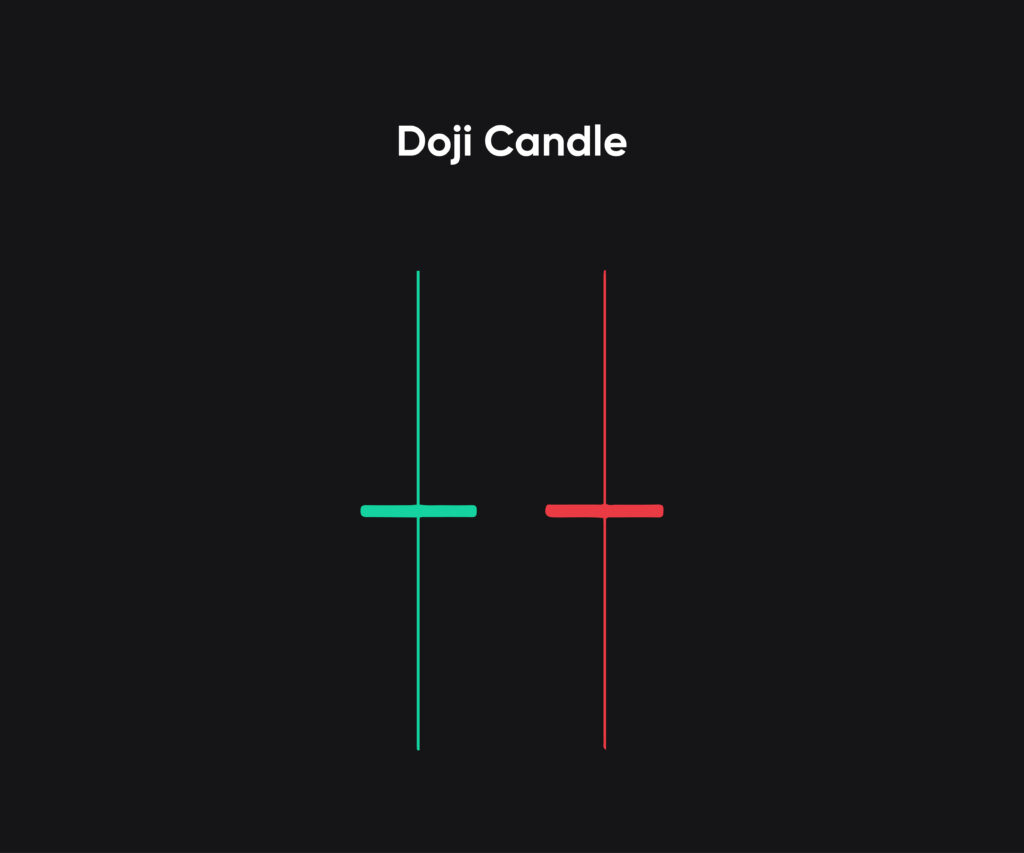
- Doji: Open and close are super close. It’s the market saying, “I’m confused.” After a big move, it might mean a flip is coming.
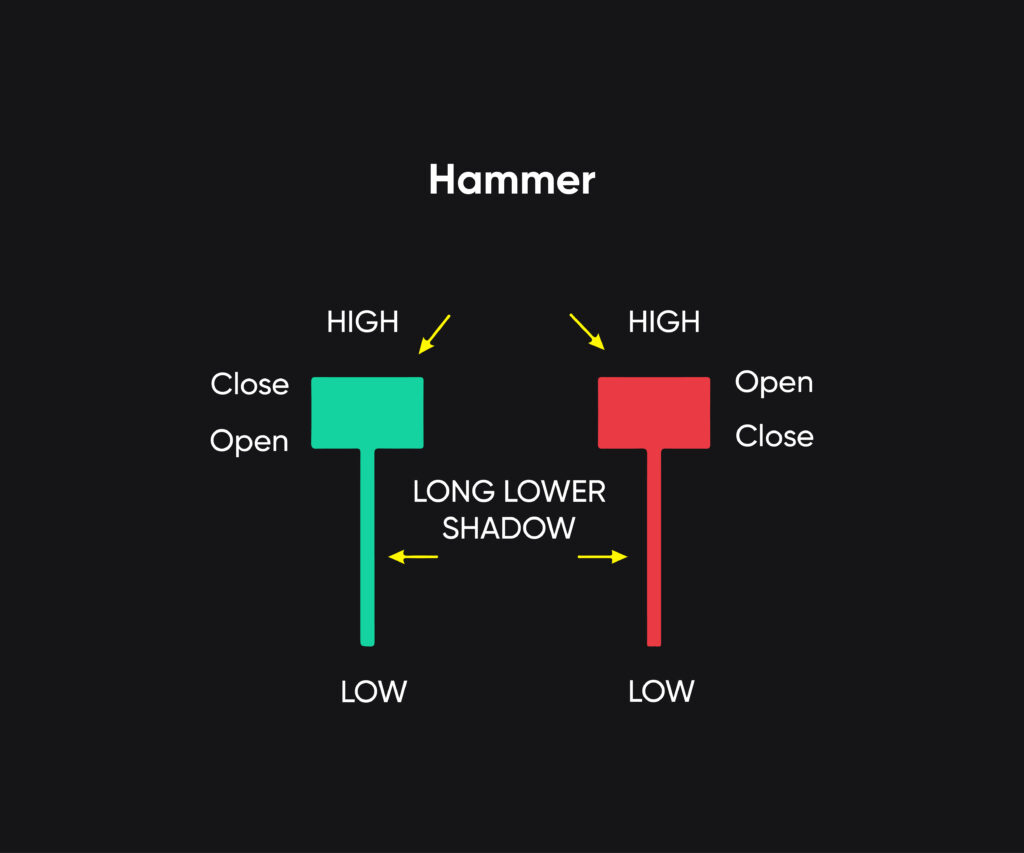
- Hammer: Tiny body, long lower wick. Shows up at the bottom of a downtrend. Buyers are stepping up.
- Inverted Hammer: A hammer turned upside down. Hints at a bounce after a drop.
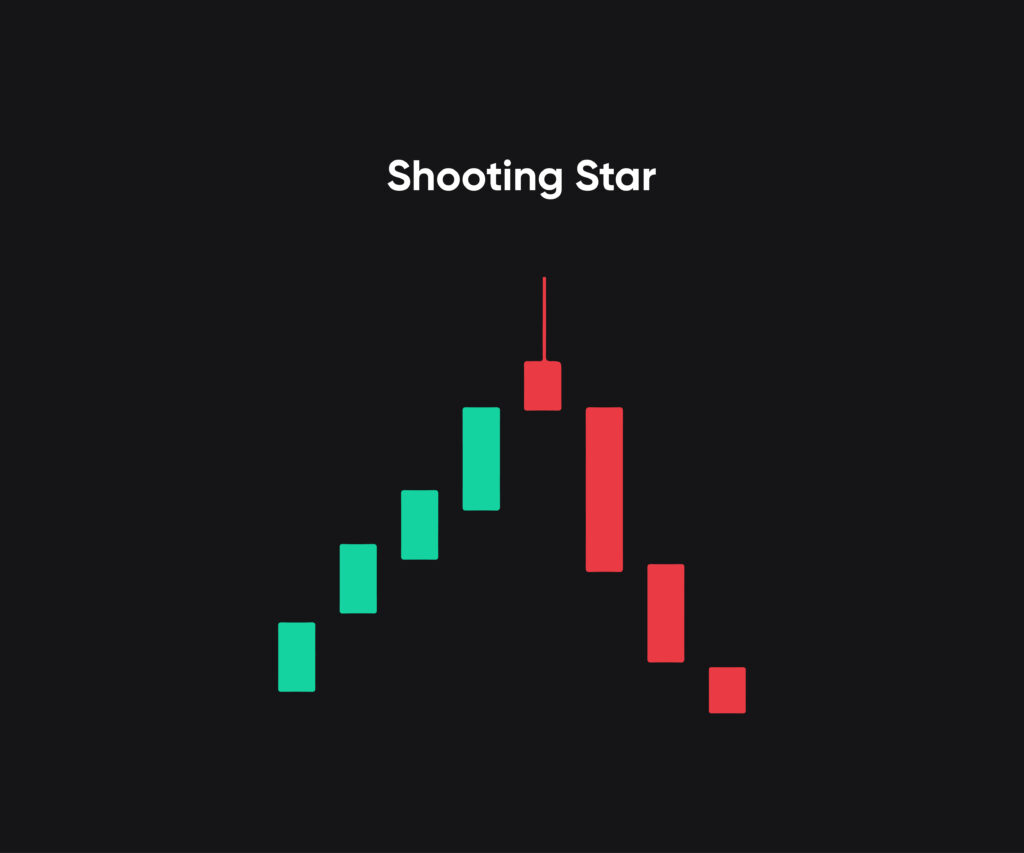
- Shooting Star: Tiny body, long upper wick. Pops up at the top of an uptrend. Sellers are creeping in.
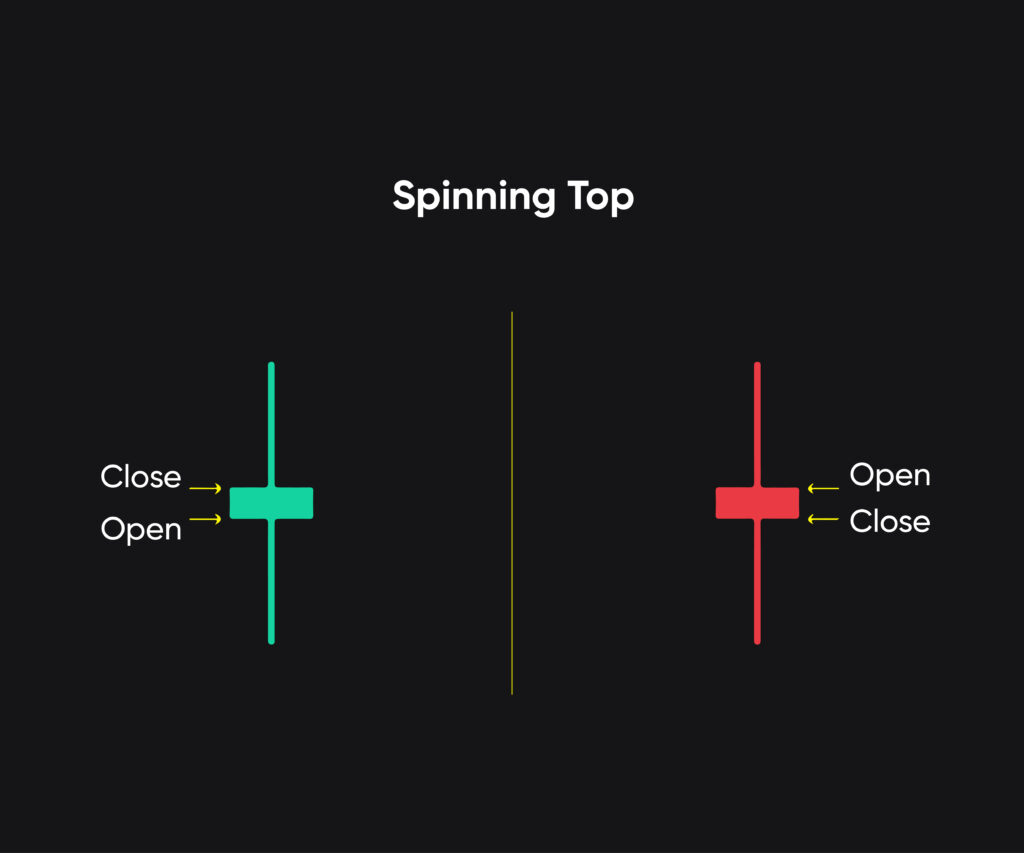
- Spinning Top: Small body, long wicks on both ends. The market’s like, “Make up your mind!”
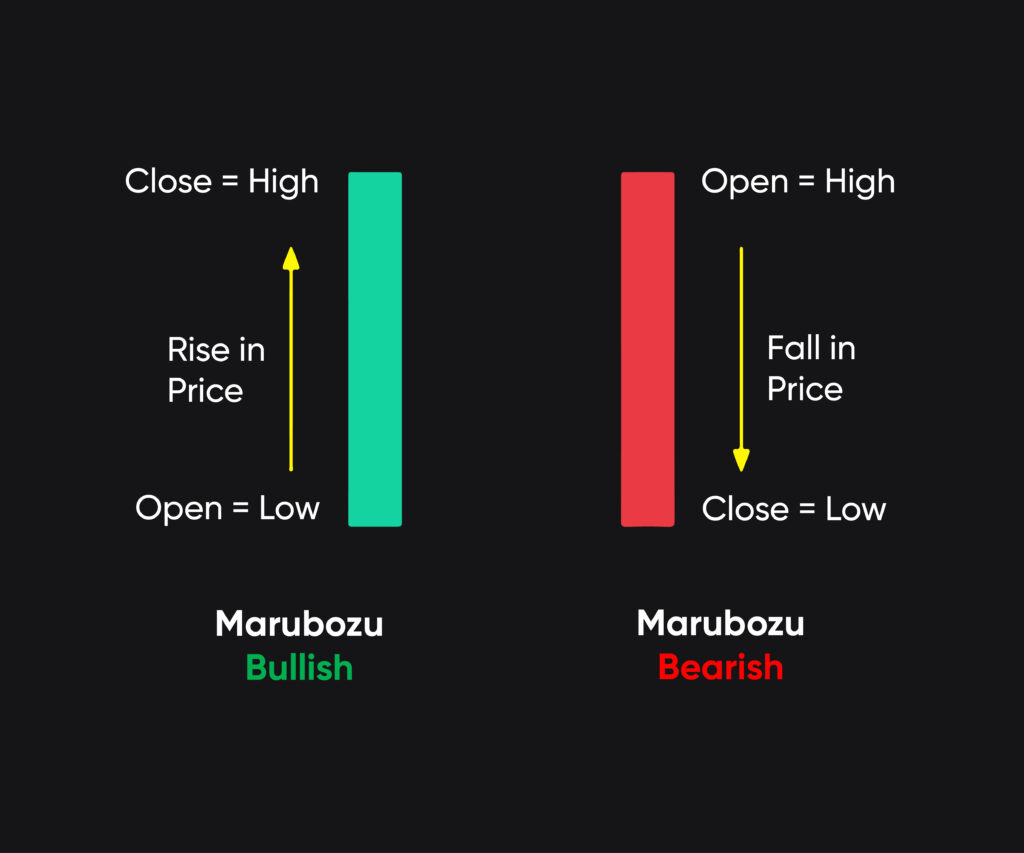
- Marubozu: No wicks, just a solid body. The market’s yelling, “We’re going THIS way!”
Multiple Candlestick Patterns
When candles team up, they tell bigger stories:
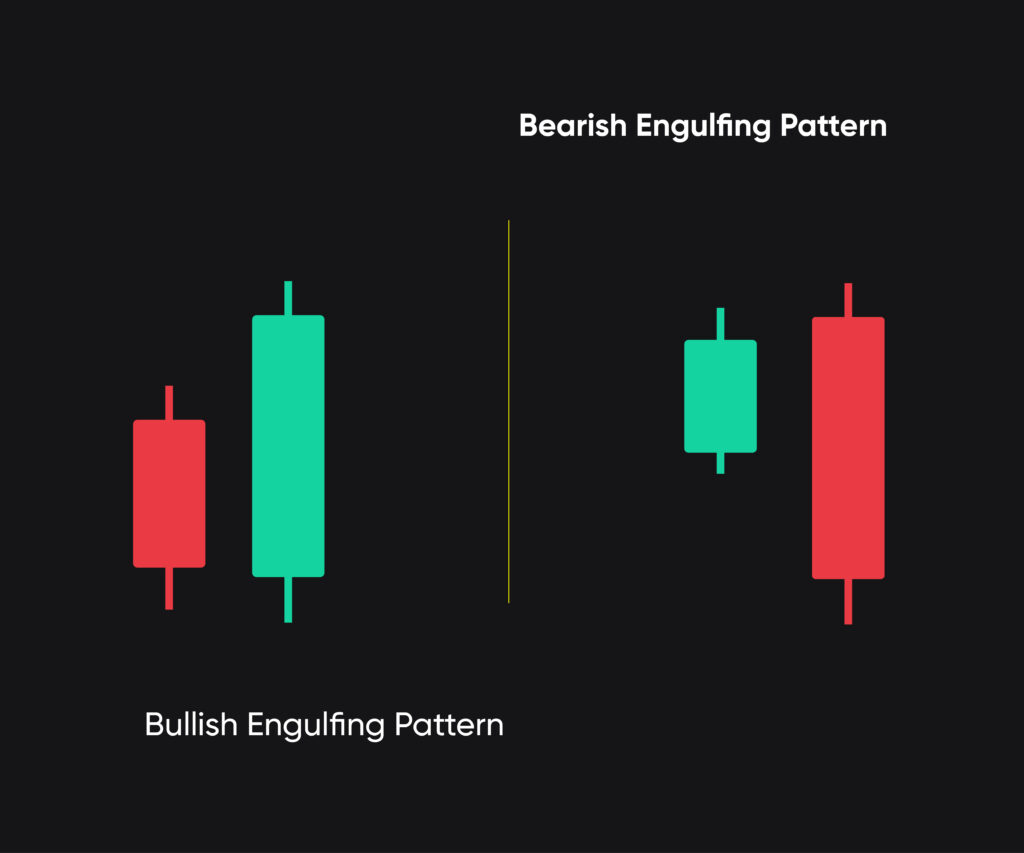
- Bullish Engulfing: A tiny red candle gets swallowed by a big green one. Could mean the bulls are charging.
- Bearish Engulfing: A small green candle dwarfed by a big red one. Sellers are taking over.
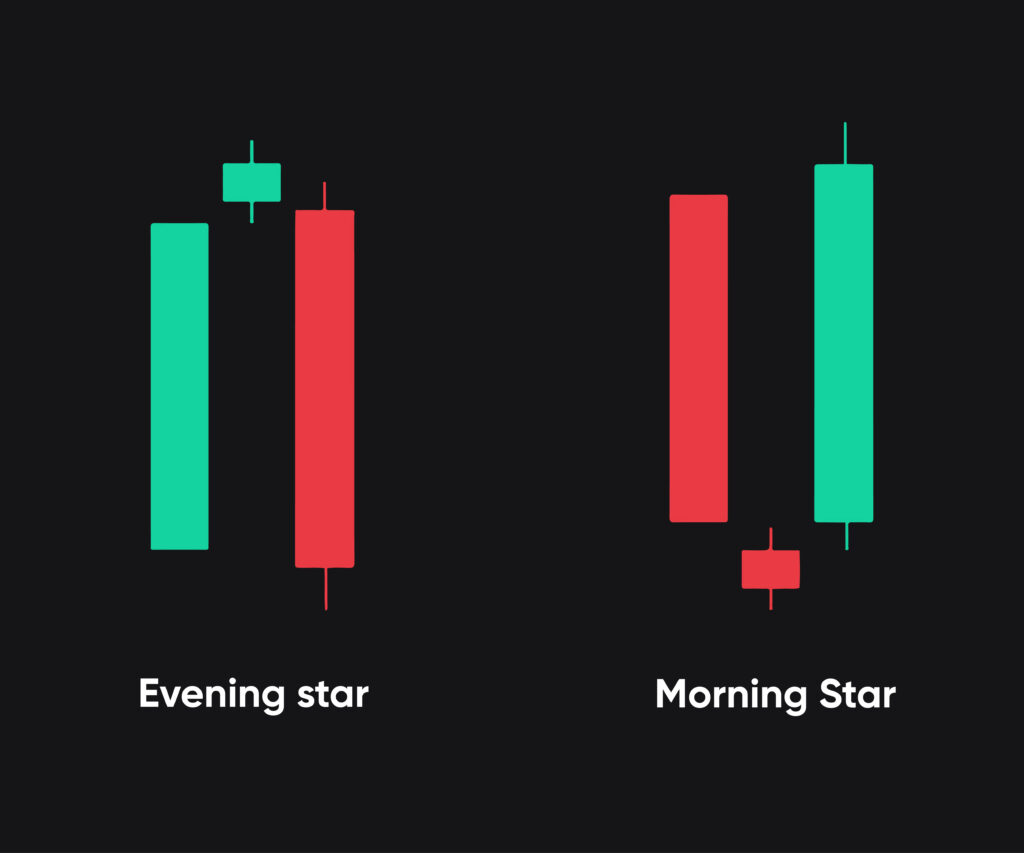
- Morning Star: Three candles: red, tiny one, then green. Signals a bearish trend might flip.
- Evening Star: Opposite of Morning Star. Hint: The Bulls are losing steam.
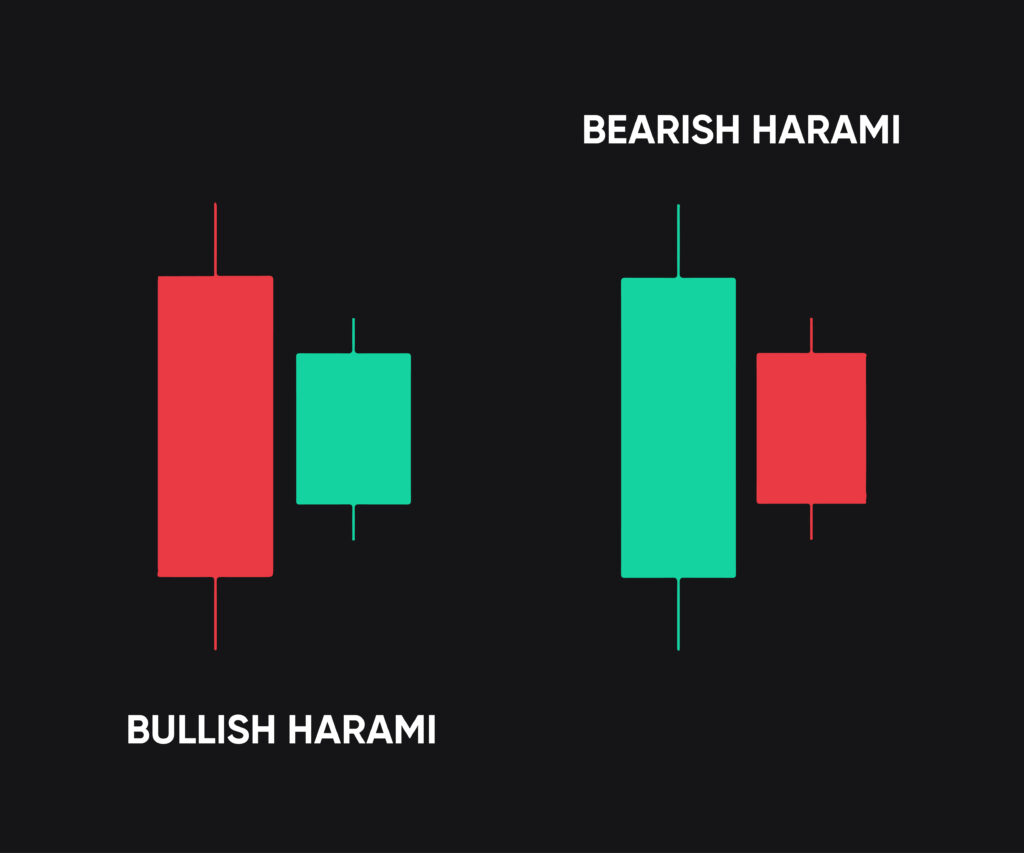
- Harami: A small candle tucked inside the last one’s body. The trend might pause or reverse.
The Psychology Behind the Candlestick Charts
Candlesticks aren’t just shapes—they’re the market’s mood swings. A hammer? That’s buyers jumping in to save the day. A shooting star? Sellers are crashing the party after a rally. Get inside the market’s head, and you’re not just reading charts—you’re reading people.
Reading Candlesticks Like a Detective
Candles don’t exist in a vacuum. You gotta check the scene:
- Trend: A bullish signal in a nasty downtrend? Probably weak.
- Volume: Big volume makes a candle’s story more legitimate.
- Support/Resistance: Patterns near key levels hit harder.
- Market Vibe: News, earnings, or global events can shake things up.
Beginner Mistakes to Dodge
Everyone screws up at first. Don’t fall for these:
- Overthinking single candles: One candle’s just a scene, not the whole story.
- Ignoring trend or volume: A bullish pattern in a downtrend can flop.
- Seeing patterns everywhere: Don’t force it. Not every candle’s a hammer.
- Jumping the gun: Wait for confirmation, or you’ll get burned.
- Sticking to one timeframe: Zoom out. The big picture saves you from bad calls.
How to Get Good at This
Practice makes you sharp. Open a demo account and stare at charts. Pick a couple of patterns and hunt for them across timeframes. Ask:
- Is this pattern at the end of a trend?
- What’s the volume saying?
- Any support/resistance nearby?
- Is news messing with the market?
Screenshot patterns, jot down what happened next, and review weekly. Or better, use a trading journal to save every detail of every trade like a pro. Then start the review process. You’ll start seeing the market’s moves like a legend.
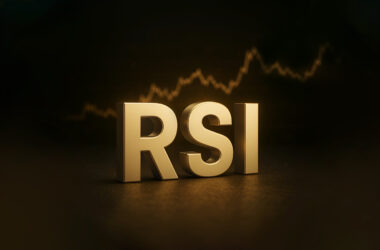
Mixing Candlesticks with Other Tools
Candlesticks are fantastic, but they’re not the whole game. Pair them with indicators and oscillators in your candlestick charts to understand the entire story:
- Moving Averages: Spot trends and key levels.
- RSI/MACD: Catch overbought or oversold zones.
- Trendlines/Channels: Give your charts some structure.
- Volume: Confirms if a move’s got juice.
This combo cuts down on bad trades and boosts confidence. We’ll cover indicators in detail later. Remember to check UltraTrader’s blog each week to learn the market’s moves.
Real-Life Examples: Reading Candlestick Charts Like a Boss
Picture this: A stock’s been climbing on a daily chart, then BAM—a big red candle with a tiny wick, followed by a doji. Momentum’s fading. If a bearish engulfing shows up next, that’s a red flag for a reversal. Time to play it safe or maybe go short.
Or say you spot a hammer after a brutal downtrend, then a green candle with huge volume. That’s your green light to jump in before the uptrend kicks off.
On a 4-hour Bitcoin chart, a morning star after a crash—paired with an oversold RSI and a volume spike—screams “buy.” That’s a trade you don’t sleep on.
Candlestick Charts and Staying Alive in Trading
Candlesticks are clues, not promises. Protect yourself with:
- Stop Losses: Save your bacon when trades go south.
- Position Sizing: Don’t bet the farm on one move.
- Confirmation: Wait for the market to back up your hunch.
- Trade Journal: Track what works, ditch what doesn’t.
A hammer might look sexy, but a bad trade can wipe you out without a stop loss. Candlesticks spot the opportunity; risk management keeps you in the game.
Wrapping It Up
Candlesticks aren’t just random bars—they’re the market’s heartbeat. Practice enough, and you’ll start reading them like a story. Keep it simple, stay patient, and don’t chase every pattern you see.
Those confusing red and green bars will become your secret weapon with time and practice.
Happy trading!
Bonus Tip: Save a few charts and check them after a week. Seeing how patterns play out is where the real magic happens.
FAQ: Your Burning Questions
Q: Do candlestick charts work for everything?
Yup—stocks, crypto, forex, commodities. If it’s got a price, it works.
Q: How many patterns should I learn?
Start with 5–6 solid ones. Nail those before chasing more. Pro advice? Don’t try to remember patterns; Try to understand the reason behind the patterns.
Q: Are candlestick patterns foolproof?
Nah, nothing’s 100%. Use them with context and risk controls.
Q: What is the best timeframe for candlestick trading?
Depends. Day traders love 5–15-minute charts. Swing traders stick to hourly or daily.