

Have you ever noticed how nature shows patterns that repeat? For example, consider the spiral of a seashell, the branching of trees, or the shape of a sunflower. These patterns often follow a series called the Fibonacci sequence. In trading, Fibonacci is not about nature; it’s a valuable tool that helps traders find likely support and resistance levels, retracements, and price targets. Whether you are dealing with the fast forex market or the fluctuating world of cryptocurrencies, knowing Fibonacci levels can help you see where prices might pause, reverse, or speed up.
What is Fibonacci Retracement?
At its heart, Fibonacci retracement comes from the Fibonacci sequence: a series of numbers where each one is the sum of the two before it (0, 1, 1, 2, 3, 5, 8, 13, 21, 34, and so on). Divide one number by the next, and you get ratios like 0.618 (61.8%), 0.382 (38.2%), and 0.236 (23.6%). These ratios, along with 0.5 (50%) and 0.786 (78.6%), are the magic numbers traders use to predict where prices might pause or reverse after a big move.
In trading, the Fibonacci retracement is a tool that plots these ratios on a price chart to identify potential support levels (where prices might stop falling) or resistance levels (where prices might stop rising). The idea is simple: after significant price swings, markets often retrace to these levels before deciding their next move. It’s like the market catching its breath before running again.
Why does this work?
People drive markets, and people tend to buy or sell at predictable levels. Fibonacci levels often align with where traders place orders, making them self-fulfilling. Whether you’re trading forex pairs like GBP/USD or crypto assets like ETH/USDT, these levels can act as a guide to navigate price swings.
How to Use Fibonacci Retracement in Trading.
Using Fibonacci retracement is straightforward, but it takes practice to get it right. Here’s how to apply it step by step:
- Spot a Price Swing: Look for a clear upward move (from a low to a high) or downward move (from a high to a low) on your chart. These are your “swing low” and “swing high.”
- Draw the Fibonacci Levels: Use your trading platform’s Fibonacci tool. In an uptrend, drag the tool from the swing low to the swing high. In a downtrend, drag from the swing high to the swing low. The tool will plot lines at 23.6%, 38.2%, 50%, 61.8%, and 78.6%.
- Watch for Action: These levels are where prices might pause, reverse, or continue. Look for signals, such as candlestick patterns or other indicators, to confirm your trade.
- Combine with Other Tools: Fibonacci works best when paired with indicators like moving averages, RSI, or trendlines to filter out false signals.
An Example Of Fibonacci in Forex
Suppose USD/JPY jumps from 140.00 to 146.00 on a daily chart, signaling an uptrend. You draw the Fibonacci tool from 140.00 (swing low) to 146.00 (swing high). The levels are:
- 23.6%: 144.56
- 38.2%: 143.48
- 50%: 143.00
- 61.8%: 142.52
- 78.6%: 141.44
If the price pulls back to 143.48 (38.2%) and forms a bullish engulfing candle, you may consider buying, expecting the uptrend to resume, with a stop-loss placed below 142.52 (61.8%).
An Example Of Fibonacci in Crypto
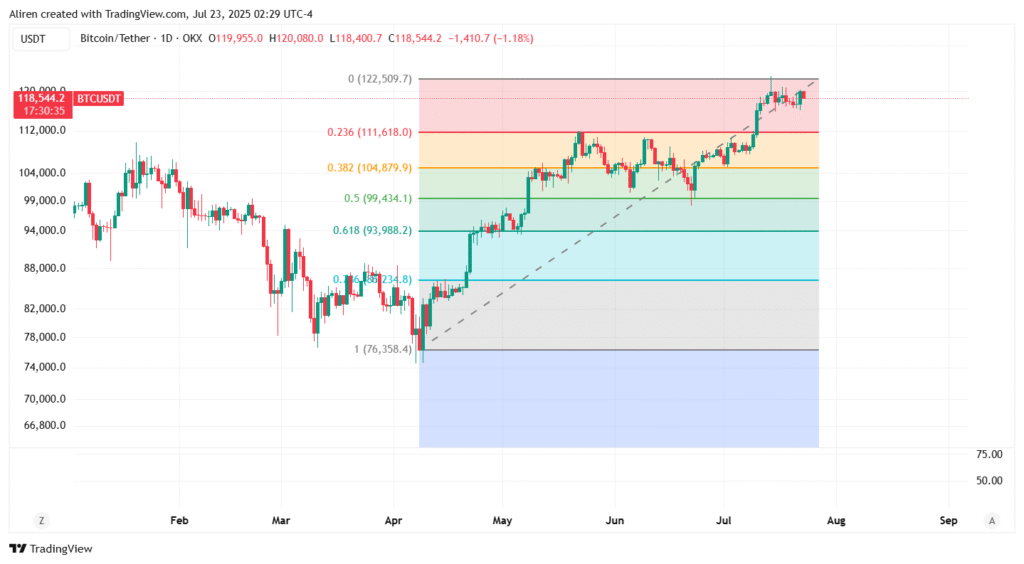
Imagine BTC/USDT crashes from $120,000 to $108,000 on a 4-hour chart. You apply Fibonacci from $120,000 (swing high) to $108,000 (swing low). The levels are:
- 23.6%: $111,120
- 38.2%: $112,680
- 50%: $114,000
- 61.8%: $115,320
- 78.6%: $116,880
If the price retraces to $114,000 (50%) and forms a bearish pin bar, you might consider selling, anticipating further declines, with a stop-loss set above $115,320 (61.8%).
Combining Fibonacci with Other Indicators.
Fibonacci retracement works best when combined with other technical indicators. This pairing helps confirm trading signals and reduces the chances of false positives. Here are the best indicators to use with Fibonacci and how they work together:
Moving Averages (MA):
- How It Works: Moving averages (like the 50-period or 200-period EMA) help identify the trend direction. When a Fibonacci level aligns with a moving average, it creates a confluence zone—a high-probability area for trades.
- Example: On a daily EUR/USD chart, the price pulls back to the 50% Fibonacci level (1.0800) after rising from 1.0600 to 1.1000. If the 200-period EMA is also at 1.0800, this confluence strengthens the case for a buy trade.
- Why It’s Effective: Moving averages confirm the trend, while Fibonacci pinpoints the retracement level, increasing trade reliability.
Relative Strength Index (RSI):
- How It Works: RSI measures momentum and identifies overbought (above 70) or oversold (below 30) conditions. When a Fibonacci level coincides with an RSI reversal signal, it suggests a potential trade.
- Example: On a 1-hour ETH/USDT chart, Ethereum retraces to the 61.8% Fibonacci level ($2,950) after an uptrend. If RSI shows oversold conditions (below 30) at this level, it’s a strong buy signal.
- Why It’s Effective: RSI confirms whether the price is overstretched, complementing Fibonacci’s price-based analysis.
MACD (Moving Average Convergence Divergence):
- How It Works: MACD shows trend momentum and potential reversals through crossovers. A Fibonacci level with a MACD crossover (e.g., bullish crossover above the zero line) signals a high-probability trade.
- Example: On a 4-hour GBP/USD chart, the price retraces to the 38.2% Fibonacci level (1.2750) after a downtrend. A bullish MACD crossover at this level suggests a reversal, prompting a buy trade.
- Why It’s Effective: MACD adds momentum confirmation to Fibonacci’s price levels.
Support/Resistance Levels and Trendlines:
- How It Works: Historical support/resistance levels or trendlines often align with Fibonacci levels, creating confluence zones. These areas are where traders are most likely to act, thereby increasing the likelihood of a price reaction.
- Example: On a daily XRP/USDT chart, XRP retraces to the 50% Fibonacci level ($2.75) after rising from $2.50 to $3.00. If this level aligns with a trendline drawn from previous highs, it’s a strong sell signal if a bearish candle forms.
- Why It’s Effective: Confluence of multiple support/resistance signals boosts confidence in the trade setup.
Candlestick Patterns:
- How It Works: Patterns like pin bars, engulfing candles, or doji candles at Fibonacci levels confirm price action. For example, a bullish engulfing candle at a 61.8% retracement suggests a potential bounce.
- Example: On a 1-hour BTC/USDT chart, Bitcoin pulls back to the 38.2% Fibonacci level ($115,000) after an uptrend. A bullish doji candle at this level signals a buy opportunity.
- Why It’s Effective: Candlestick patterns provide visual confirmation of trader sentiment at key Fibonacci levels.
Volume Analysis:
- How It Works: High trading volume at a Fibonacci level indicates strong buyer or seller interest, confirming the level’s importance. Low volume might suggest a false signal.
- Example: On a 4-hour AUD/USD chart, the price retraces to the 50% Fibonacci level (0.6700). If volume spikes at this level alongside a bullish candle, it’s a strong buy signal.
- Why It’s Effective: Volume validates the significance of Fibonacci levels, reducing the risk of false breakouts.
Fibonacci Trading Strategies for Forex and Crypto.
Here are three practical strategies for using Fibonacci retracement in forex and crypto trading, complete with examples, pros, and cons.
Trend Continuation Strategy.
This strategy involves trading pullbacks to Fibonacci levels in a trending market, with the expectation that the trend will resume. How to Use:
- Confirm a strong trend using indicators such as the 50-period EMA or the ADX.
- Draw a Fibonacci retracement on the recent price swing.
- Wait for the price to retrace to a key level (e.g., 38.2% or 61.8%) and look for confirmation (e.g., a bullish candle, an oversold RSI, or a MACD crossover).
- Enter a trade in the trend’s direction, with a stop-loss below the next Fibonacci level and a target near the previous swing high/low.
Forex Example:
On a 4-hour USD/CAD chart, the price rises from 1.3500 to 1.3900, with the 50-period EMA sloping upward, confirming an uptrend. You draw Fibonacci from 1.3500 to 1.3900. The price pulls back to the 38.2% level (1.3752) and forms a bullish pin bar with RSI at 40 (neutral). You buy at 1.3755, with a stop-loss at 1.3680 (below 50%) and a target at 1.3950. The price hits your target as the uptrend resumes.
Crypto Example:
On a daily SOL/USDT chart, Solana climbs from $150 to $180. You apply Fibonacci from $150 to $180. The price retraces to the 61.8% level ($162) and shows a bullish engulfing candle with high volume. You buy at $162.50, with a stop-loss at $158 (below 78.6%) and a target at $185. The trade succeeds as Solana continues upward.
Pros:
- High probability in trending markets.
- Clear entry, stop-loss, and target levels.
- Works well with confirmation indicators.
Cons:
- Fails in choppy or range-bound markets.
- Deeper retracements can lead to stop-outs if not appropriately managed.
Reversal Trading Strategy:
This strategy focuses on spotting price reversals at critical Fibonacci levels (61.8% or 78.6%) in trends that are losing strength or are stuck in a range. How to Use:
- Identify a range-bound market or a trend losing momentum (e.g., RSI divergence or MACD weakening).
- Draw a Fibonacci retracement on the price swing.
- Look for reversal signals at deeper levels (61.8% or 78.6%), such as double tops/bottoms or candlestick patterns.
- Enter a trade against the trend, with a stop-loss beyond the swing high/low.
Forex Example:
On a daily EUR/GBP chart, the price falls from 0.8700 to 0.8400, but RSI shows divergence, suggesting a weakening downtrend. You draw Fibonacci from 0.8700 to 0.8400. The price retraces to the 61.8% level (0.8580) and forms a double top, accompanied by a bearish MACD crossover. You sell at 0.8575, with a stop-loss at 0.8620 (above 78.6%) and a target at 0.8450. The price drops to your target.
Crypto Example:
On a 1-hour DOGE/USDT chart, Dogecoin rises from $0.18 to $0.22, but RSI is overbought (above 70). You apply Fibonacci from $0.18 to $0.22. The price retraces to the 78.6% level ($0.213) and forms a bearish engulfing candle. You sell at $0.212, with a stop-loss at $0.215 (above the swing high) and a target at $0.195. The trade succeeds as Dogecoin falls.
Pros:
- High reward-to-risk ratio at deeper levels.
- Effective in range-bound markets.
- Combines well with reversal indicators.
Cons:
- Risky in strong trends where reversals may fail.
- Requires precise confirmation to avoid false signals.
Confluence Zone Strategy:
This strategy uses Fibonacci levels alongside other support/resistance zones for high-probability trades. How to Use:
- Draw a Fibonacci retracement on a price swing.
- Identify confluence where Fibonacci levels align with support/resistance, trendlines, or moving averages.
- Enter a trade when the price hits the confluence zone, confirmed by candlestick patterns, volume, or other indicators.
- Set stop-loss and take-profit levels based on nearby Fibonacci levels.
Forex Example:
On a 4-hour NZD/USD chart, the price rises from 0.6000 to 0.6400. You draw Fibonacci from 0.6000 to 0.6400. The 50% level (0.6200) aligns with a trendline support, and the 200-period EMA—a bullish doji candle forms at 0.6200, accompanied by a volume spike. You buy at 0.6205, with a stop-loss at 0.6150 (below 61.8%) and a target at 0.6300. The price hits your target.
Crypto Example:
On a daily BNB/USDT chart, BNB falls from $700 to $650. You apply Fibonacci from $700 to $650. The 38.2% level ($665) coincides with a previous resistance-turned-support level and high volume—a bullish hammer candle forms at $665. You buy at $666, with a stop-loss at $660 (below 50%) and a target at $680. The trade succeeds as BNB rebounds.
Pros:
- High-probability setups due to multiple confirmations.
- Works across trending and ranging markets.
- Clear risk management with defined levels.
Cons:
- Complex for beginners due to multiple indicators.
- Confluence zones may not always align perfectly.
Advantages and Limitations of Fibonacci Retracement
Advantages:
- Versatile: Works in forex (e.g., USD/JPY) and crypto (e.g., BTC/USDT) across timeframes.
- Easy to Use: Built into most trading platforms, requiring minimal setup.
- Psychological Edge: Aligns with levels where traders place orders, enhancing reliability.
- Flexible Strategies: Supports trend continuation, reversals, and confluence trading.
Limitations:
- Subjective Selection: Choosing the right swing high/low can be tricky, especially for beginners.
- Not Always Reliable: Fibonacci levels can fail during high-impact news or low-liquidity periods.
- Needs Confirmation: Relies on other indicators to filter false signals, adding complexity.
- Crypto Volatility: Crypto markets’ extreme swings can make Fibonacci less predictable than in forex.
Conclusion:
Mastering Fibonacci retracement helps traders navigate the forex and crypto markets. It identifies support and resistance levels, enhancing your trading timing, risk management, and profit target setting. Whether trading USD/CAD or DOGE/USDT, Fibonacci provides a straightforward method to read price movements.
Utilize strategies such as trend continuation, reversal trading, and confluence zones to adapt to varying market conditions. Pair Fibonacci with tools like moving averages, RSI, MACD, and candlestick patterns to enhance your success. Don’t forget to use a trading journal to analyze your performance using Fibonacci-based strategies. This will help you to maximize your profits in trading.
Start with straightforward setups on higher timeframes to build confidence, and always test on a demo account first. While it can’t predict the future, the Fibonacci sequence is a valuable tool that combines mathematics with trader psychology.