


Are you interested in using the Relative Strength Index (RSI) to enhance your trading strategy? This helpful guide will walk you through the basics of what the RSI is, how to interpret its signals, and provide valuable tips on applying RSI in different market conditions. Let’s dive in together!
Trading is as much about understanding momentum as it is about price. One of the most widely used tools to measure momentum in financial markets is the Relative Strength Index. For decades, traders have relied on it to spot potential reversals, confirm trends, and fine-tune entry and exit points.
This guide will provide an in-depth explanation of what the RSI is, how it works, how it is calculated, and how you can apply it in your trading with practical, real-world strategies.
The Origin of RSI
J. Welles Wilder Jr. developed the Relative Strength Index (RSI), a popular technical analysis tool. Before he began trading, Wilder had an interesting career as a Navy mechanic and then as a mechanical engineer. After trading commodities for a while, he became interested in technical analysis and wanted to learn more. In 1978, he published his important book, *New Concepts in Technical Trading Systems*, where he introduced the RSI to the world.
Since then, the RSI has become a favorite among technical analysts everywhere and is considered one of the key tools for analyzing market trends. Many in the trading community, such as Andrew Cardwell, have taken Wilder’s ideas and built upon them, utilizing the RSI for trend confirmation. It’s great to see how Wilder’s work continues to inspire and help traders today!
What is the Relative Strength Index
The Relative Strength Index is a momentum oscillator used in technical analysis to measure the speed and magnitude of price movements. It evaluates how quickly and strongly prices are changing by comparing the magnitude of recent gains to recent losses over a specified period.
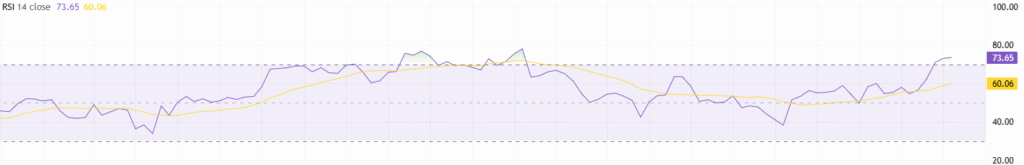
The result is a single number that ranges between 0 and 100. This number indicates to traders whether an asset’s price movement has been strong in one direction and may be due for a pullback or reversal.
Values above 70 are often interpreted as indicating that the asset is in an overbought condition, meaning it has risen quickly and may correct lower. Values below 30 are interpreted as oversold, indicating that the asset has fallen rapidly and may be due for a bounce higher.
However, these thresholds are guidelines rather than rules. In strong trends, prices can remain overbought or oversold for extended periods. This is why traders do not rely solely on the RSI but instead combine it with other tools for confirmation.
Beyond simple overbought and oversold levels, the RSI can also reveal divergences between price and momentum, which are often early signals of trend changes.
How the Relative Strength Index is Calculated
The Relative Strength Index (RSI) measures price changes in assets, such as stocks, forex, and cryptocurrencies, over a specified period, typically 14 days. It displays values between 0 and 100, with 50 being the midpoint.
RSI is calculated using this formula:
RSI = 100 – (100 / (1 + RS))
Where RS (Relative Strength) is the average price gain on up days divided by the average loss on down days during the same period.
A value above 50 suggests that the asset is gaining strength, while a value below 50 indicates weakness. Traders use the RSI to find assets that are overbought or oversold, confirm trends, and identify possible trend reversals when prices diverge. They often use the RSI in conjunction with other tools, such as moving averages and Bollinger Bands, to obtain clearer signals.
RSI Trading Strategies
1. Overbought and Oversold Levels
In technical analysis, we often talk about when an asset is overbought or oversold. This occurs when the price makes a significant move in one direction, indicating it may be time for a correction or a return to a more average price level. The Relative Strength Index (RSI) is a valuable tool for this purpose. It ranges from 0 to 100, with 70 typically being the overbought level and 30 the oversold level.
When the RSI exceeds 50, it indicates that bullish momentum is increasing, suggesting the asset may continue to trend upward. On the other hand, if it drops below 50, it indicates bearish momentum, suggesting that further downside may be ahead. It’s a great way to stay informed about market trends!
2. Divergence Strategy
A divergence occurs when price moves in one direction, but RSI moves in the opposite direction.
- Bullish Divergence: Price makes lower lows while RSI makes higher lows. This indicates weakening selling pressure and a potential price increase.
- Bearish Divergence: Price makes higher highs while RSI makes lower highs. This suggests weakening buying pressure and a potential price drop.
Divergences are most potent when they occur at significant support or resistance levels. Combining them with candlestick reversal patterns further increases their reliability.
3. RSI Swing Rejection
This method, introduced by the creator of RSI, focuses on price rejecting a prior RSI swing level.
Bullish Swing Rejection:
- RSI drops below 30 (oversold).
- RSI bounces but does not exceed 70.
- RSI forms a higher low and breaks its prior high.
- This sequence indicates a strengthening bullish trend.
Bearish Swing Rejection:
The reverse applies for overbought conditions.
This strategy often captures trend reversals earlier than waiting for RSI to move out of overbought or oversold territory.
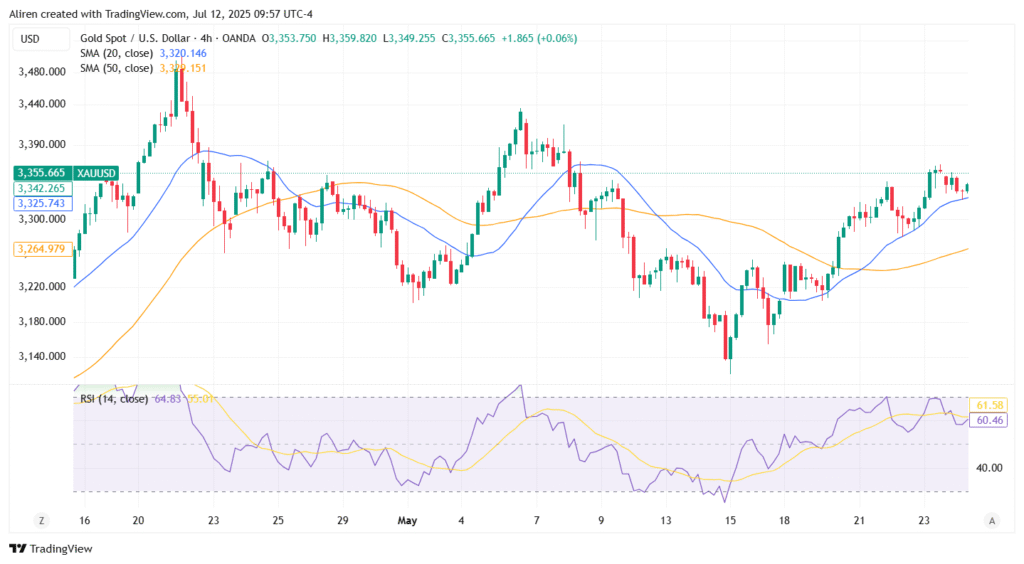
4. Combining RSI with Moving Averages
By adding moving averages, traders can filter RSI signals to trade in the direction of the broader trend.
- Buy Signal: RSI rises above 30 while the short-term moving average crosses above a long-term moving average.
- Sell Signal: RSI falls below 70 while the short-term moving average crosses below the long-term moving average.
This combination reduces the chance of entering counter-trend trades. A sell signal can be seen in the XAUUSD chart.
5. RSI and Bollinger Bands
Bollinger Bands identify volatility and price extremes. When RSI is in an overbought or oversold condition while the price touches or breaks out of a Bollinger Band, it strengthens the signal.
This approach works well for spotting short-term reversals in high-volatility markets.
Advantages of RSI
The Relative Strength Index (RSI) is a popular momentum oscillator that offers several advantages for trading financial markets:
- Simplicity: The RSI’s simplicity stems from its clear and concise signals, as well as its ease of interpretation.
- Identifying Overbought and Oversold Conditions: It remains one of the simplest methods to alert traders to focus on a particular asset. When an asset enters the overbought or oversold zones around 70 and 30, it is easy to notice when the RSI reverses out of these zones, indicating a shift in momentum.
- Divergence Detection: The RSI can indicate when price and momentum are misaligned, signaling potential opportunities for traders. If the RSI increases while the price decreases, it signals a bullish divergence. Conversely, if the RSI decreases while the price increases, it signifies a bearish divergence.
Disadvantages of RSI
The RSI has many advantages, but as traders, you must ensure that you understand the limitations and disadvantages that arise.
- False Signals/Counter-Trend Trading: In trending market conditions, the RSI can remain in the overbought or oversold zones for extended periods. This means that the overbought and oversold levels don’t necessarily provide reliable signals, as taking a trade while the RSI is in these zones could result in a “false signal” due to trading against the trend.
- It’s a Lagging Indicator: It’s essential to remember that the RSI is a lagging indicator. This means it may not provide the most timely signals, particularly in fast-moving markets. By the time the RSI responds, the opportunity might have already passed. Therefore, patience is crucial, and waiting for the proper setups is essential.
Conclusion
The Relative Strength Index is more than just a basic indicator for overbought and oversold levels. It is a versatile tool for measuring momentum, spotting divergences, and confirming trends. While RSI is simple in design, its applications can be highly sophisticated when combined with other analysis techniques.
To use RSI effectively, practice identifying its signals in different market conditions and always confirm with additional tools. With time and experience, RSI can become a reliable ally in your trading strategy. To fully utilize this indicator, you must record each trade you make. This will help you to understand if you’ve understood how to use the RSI. Using a trading journal has a significant impact on your road to success in trading.