


The week after the December FOMC meeting was dominated by the 25 bps rate cut, softer US data, and shifting risk sentiment. The Fed moved the target range to 3.50%–3.75%, and its dot plot pointed to a gradual path toward the low‑3% area by 2027. This pushed US yields and the US Dollar Index (DXY) lower. This combination created a classic environment where gold and crypto found buyers on dips while the dollar stayed under pressure.
Macro Backdrop
The labor market is clearly softening. Jobless claims rose sharply, marking the biggest weekly increase in more than four years. This reinforces the idea that the Fed has room to ease further if needed. At the same time, inflation remains above target and tariffs keep upward pressure on prices, so the Fed cannot cut aggressively without risking its credibility.
Geopolitical risk also matters. Headlines about a potential Ukraine peace framework supported gold earlier in the week but could later limit safe‑haven demand if those talks progress. In summary, we are in a “lower yields, weaker dollar, but not a crisis” regime, which typically supports gold, Bitcoin, and Ethereum while capping the upside in DXY.
DXY – US Dollar Index
Fundamentals
After the Fed decision, the DXY dropped to around 98.35, an 8‑week low, as markets priced in more easing in 2026. Several analysts described this move as a continuation of an existing downtrend rather than a new shock. The narrative is that the dollar’s rate advantage is shrinking as US yields decline, while global risk sentiment improves.
Technical View
Data from TradingEconomics show the index at roughly 98.39 on December 12, with a 0.77% loss over the month and an 8% drop over the past year. Technical commentary focuses on 98.0 as a key support zone, with follow‑through risk toward 97.5–96.8 if selling pressure continues. On the upside, 98.8–99.0 is seen as an important short‑term resistance band, with the 100.0–100.4 region linked to the November high area.
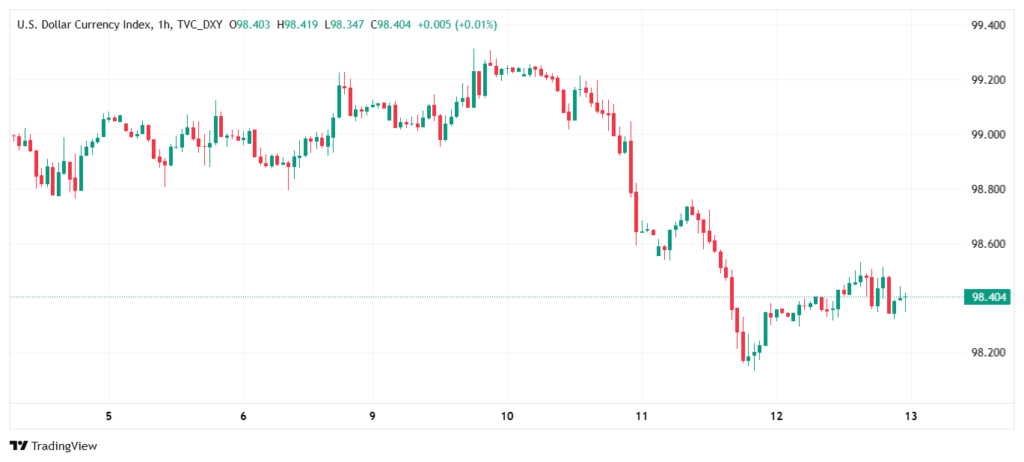
Trading bias:
- Primary idea: sell rallies into 98.8–99.0, targeting 98.0 first and then 97.5 if momentum stays bearish.
- Risk management: a daily close above roughly 99.0 would signal that the breakdown is losing strength and that shorts should tighten stops or reduce exposure.
Gold (XAU/USD)
Fundamentals
Gold broke above 4,250 USD/oz and traded around 4,275 after the Fed cut, reaching a seven‑week high thanks to the weaker dollar and lower Treasury yields. The market saw the Fed as dovish enough to hurt the dollar but not enough to trigger an inflation panic, which is a supportive mix for gold.
Long‑term narratives remain intact: central bank diversification away from the dollar, persistent geopolitical risk, and expectations that inflation will not fall back to 2% quickly. This is why some analysts still talk about 4,500–5,000 as plausible medium‑term targets after the 2025 breakout above 4,000.
Technical View
Short‑term technical research describes the move above 4,250 as a clean breakout in an established uptrend. Key levels mentioned repeatedly:
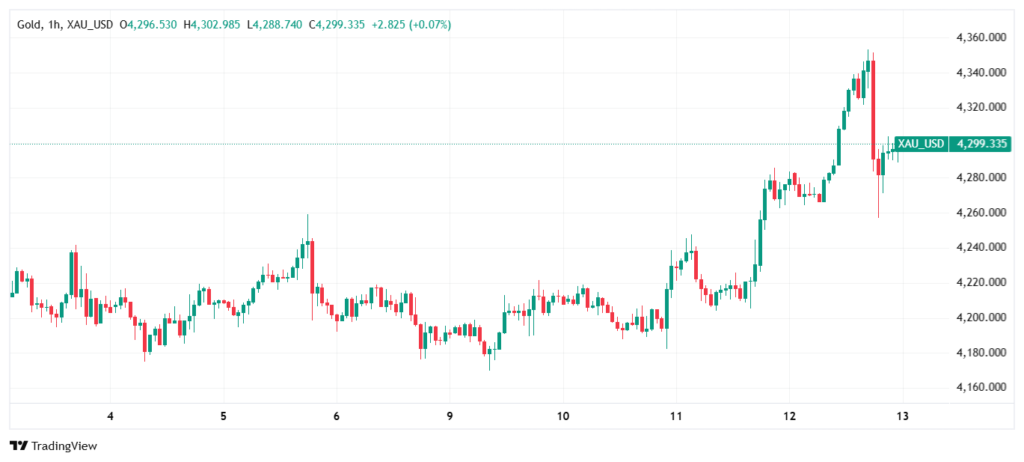
- Resistance: 4,300–4,365 as the next upside zone, and then 4,400–4,500 for medium‑term projections.
- Support: 4,250 as initial support (former resistance), then 4,200, and finally the 4,000 psychological area as major swing support.
Momentum indicators on the daily timeframe are in overbought territory, so many desks expect a corrective move or sideways consolidation before the next leg higher.
Trading bias:
- Swing long setups: buy pullbacks into 4,200–4,250 with an invalidation level below 4,000 and upside targets around 4,365 and higher.
- Short‑term mean reversion: intraday traders may fade extensions near 4,300 if momentum slows, looking for a retracement back toward the 4,250 breakout area.
Bitcoin (BTC)
Fundamentals
Bitcoin initially reacted positively to the Fed cut, but the rally above 93,000 faded, and the price dropped back below 90,000 later in the week. Exchange data show BTC trading around 89,900–90,000, with daily losses of 0.5%-2.2% across different 24‑hour windows.
Several outlets point out that Bitcoin is currently caught between supportive ETF flows and short‑term profit‑taking. December reports highlight that spot Bitcoin ETFs returned to net inflows, signaling that institutional investors are slowly adding exposure on dips after heavy outflows in November. At the same time, some commentary mentions “Bart Simpson” patterns on intraday charts, a way to describe choppy spikes and dumps designed to trigger stops.
Technical View
BTC is trading in a clear range, just below a major resistance band and just above a key psychological support level. Technical research clusters the important zones as follows:
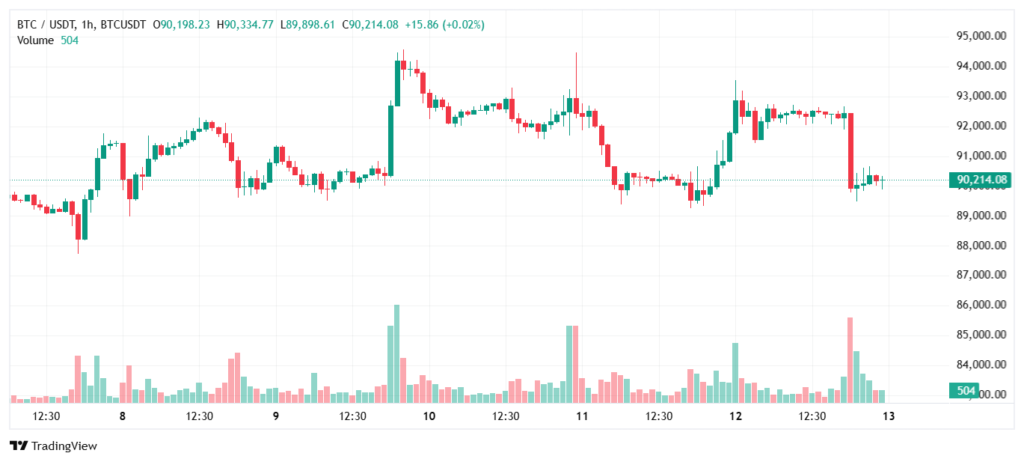
- Resistance: 94,000–95,000, with a broader upside target near the 100,000 psychological level if this resistance breaks.
- Support: 90,000 as a major line in the sand, with intraday wicks into the high‑89k area consistently bought so far.
Some analysts mention 94,000–94,300 as a key Fibonacci retracement of the April–October move. They see a daily close above this level as confirmation that the correction from the 126k high has finished. On the downside, a clean break and daily close well below the 89k–88k area would open the door to a deeper test of support in the mid‑80k region.
Trading bias:
- Base case: sideways trading in roughly 89k–94k until a new catalyst, with a slight upside bias as long as 90k holds and ETF flows stay positive.
- Breakout plan: for many traders, the high‑conviction long trigger is a daily close above 94k–94.3k, with an initial target at 100k and stops below the breakout zone.
Ethereum (ETH)
Fundamentals
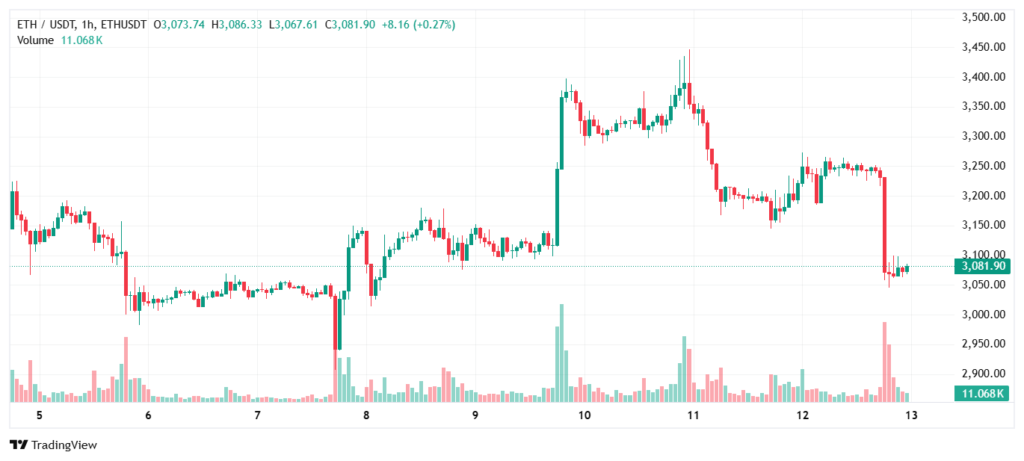
ETH is moving in BTC’s shadow. It benefits from the same macro environment (lower yields, weaker USD, constructive crypto sentiment), but attracts less headline attention and smaller ETF flows compared to Bitcoin. Still, analysts highlight that Ethereum keeps its core narratives: DeFi activity, a strong Layer‑2 ecosystem, and its role as the main smart‑contract platform.
Technical View
Recent Ethereum technical reports describe a recovery after prior losses, with price trading in the low‑3,000 region and repeatedly failing to clear resistance around 3,300–3,400. Key levels:
- Resistance:
- 3,300–3,400: previous support turned into resistance, and a key retracement area of the last down‑move.
- 3,600: a higher resistance zone that some medium‑term wave counts use as a potential target if 3,400 breaks.
- Support:
- 3,000–3,050: current short‑term floor and important psychological level.
- Around 2,900–2,950: deeper support area often referenced in wave‑based and swing‑trading scenarios.
Momentum is neutral to slightly constructive. ETH has bounced from prior lows, but trading volume and follow‑through are weaker than in BTC, so ETH behaves more as a follower. The probability of a sustained move higher increases significantly if Bitcoin breaks out above its own resistance band.
Trading bias:
- Bullish trigger: a break and daily close above the 3,300–3,400 zone, ideally with BTC already holding above 94k; this would validate long setups toward 3,600.
- Risk line: sustained closes below 3,000 would be a warning sign for a deeper move into the high‑2,000 support area.
Cross‑asset summary for trading journals
| Asset | Narrative | Key Resistance | Key Support | Short‑term Bias |
| DXY | Post‑Fed downtrend as rate premium fades | 98.8–99.0; then 100+ | 98.0; then 97.5–96.8 | Bearish, sell rallies |
| Gold | Fed cut + weak USD drive safe‑haven bid | 4,300–4,365; then 4,400+ | 4,250; then 4,200 and 4,000 | Bullish, buy dips |
| BTC | ETF inflows vs profit‑taking; 90k is the pivot | 94k–95k; then 100k | 90k; then high‑80k region | Range with upside bias |
| ETH | Follows BTC; needs 3,400 breakout | 3,300–3,400; then 3,600 | 3,000–3,050; then high‑2k | Recovery consolidation |
How To Apply This In UltraTrader
From an UltraTrader perspective, the key step is to connect trade decisions with this macro‑technical context in your trading journal:
- Tag trades by macro regime (for example, “post‑FOMC weak dollar”) so you can later measure how your setups perform in easing cycles versus hiking cycles.
- For each instrument, reference these levels directly in your notes: “short DXY from 98.90 into 98.0 support,” “gold pullback long from 4,230 into 4,350,” “BTC range trade 90k→94k,” or “ETH breakout attempt above 3,400.”