


Imagine you’re watching your favorite cryptocurrency or forex pair bouncing around on the chart. Sometimes, it seems as if the price hits invisible walls, either bouncing back or shooting straight through. Those invisible barriers are the concepts known in trading as support and resistance.
If you want to use technical analysis as the basis of your trading, learning and understanding support and resistance is a must, period. Let’s be honest. You can’t be a TA trader without understanding these two concepts. In this post, we will learn the basics of support and resistance.
Understanding the Basics of Support and Resistance
Support and resistance are the psychological battlegrounds between buyers (demand) and sellers (supply).
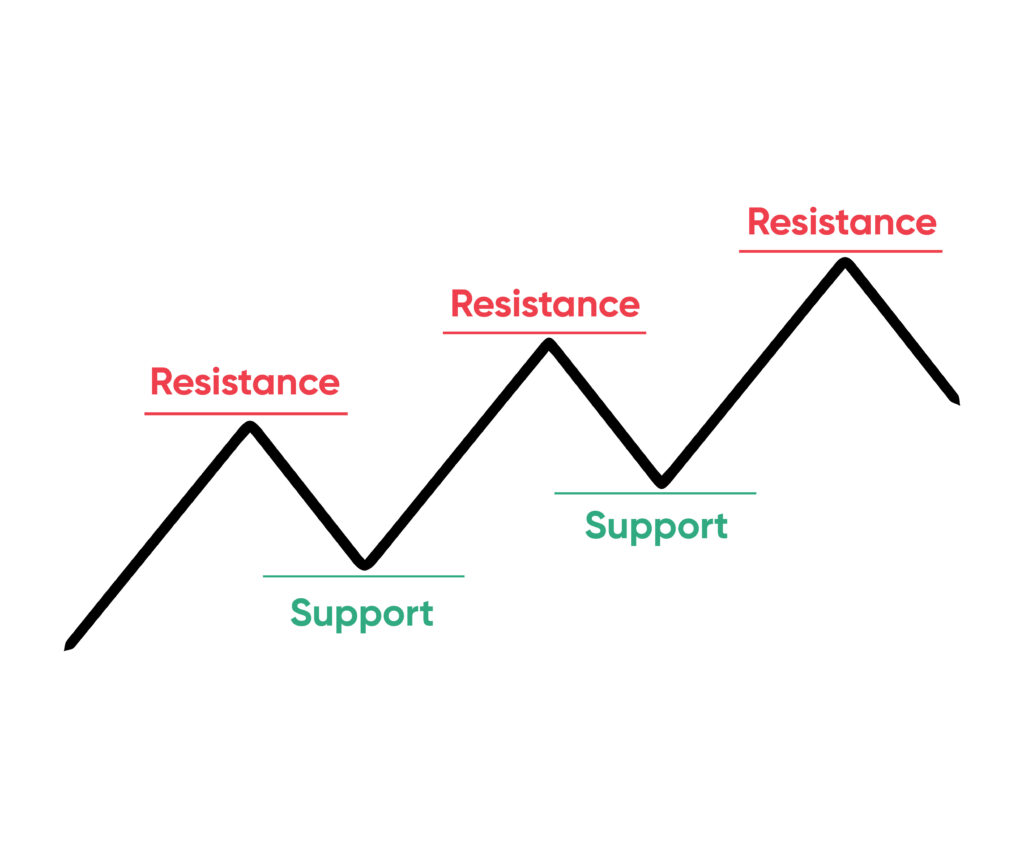
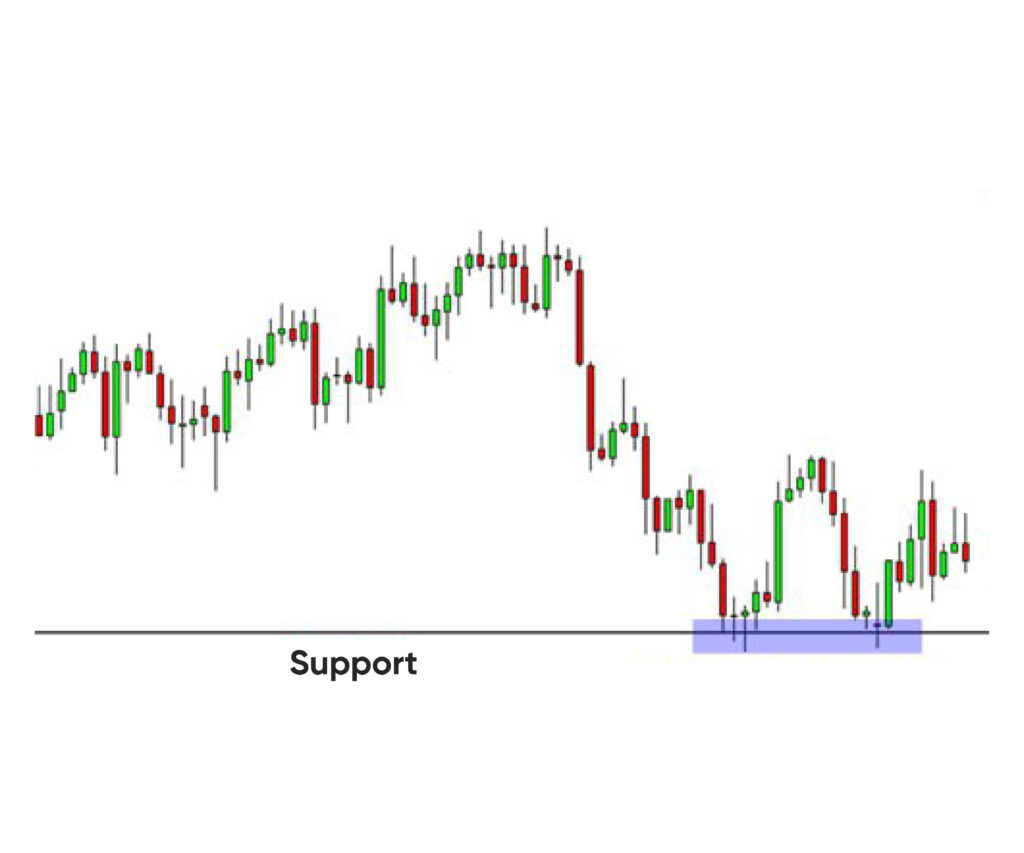
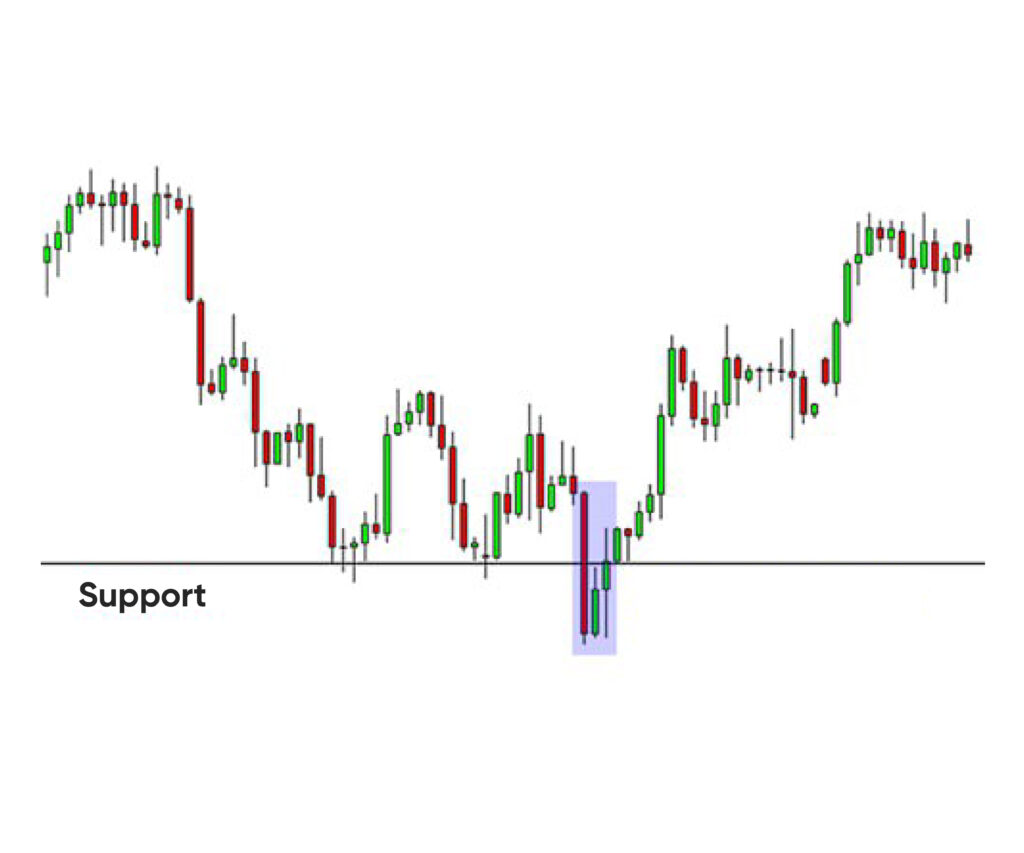
Support is a price level where there’s a strong demand that prevents the price from falling further. It’s like a rock-solid floor, preventing prices from dropping beneath it.
Conversely, resistance is like a ceiling; it’s a price level where selling pressure is sufficiently strong to prevent prices from rising higher.
Why Do These Levels Form?
Support and resistance levels are not arbitrary—they emerge from real market dynamics driven by traders’ emotions and behavior. When prices drop to a certain level, buyers perceive a good deal and step in to buy, which drives prices upward and creates a support level. Similarly, resistance forms when prices rise to a level that sellers perceive as too expensive or a suitable point to take a profit, prompting them to sell and pushing prices back down.
Pro Tip: Taking profit acts like a sell order in the market. That’s the reason behind sharp movements in some specific prices.
Psychological Factors
Psychology heavily influences the formation of support and resistance. Traders are inherently drawn to round numbers and significant price points, often placing buy and sell orders around these levels.
The more the price reacts to a specific level, the more solid that level acts as support and resistance because this repeated pattern plays a significant psychological role in the market.
Market Memory
To truly understand the market, you should view it as a living entity with a strong memory. Support and resistance levels are often shaped by their past experiences.
Supply and Demand Dynamics
Do you recall the basics of supply and demand? They are the fundamental principles of economics and are still relevant. When demand exceeds supply at a certain price level, prices rise, establishing a support level. Conversely, when supply surpasses demand, prices fall, creating resistance.
Why Do These Levels Matter?
Understanding support and resistance gives traders critical information about market sentiment.
At support, traders often anticipate that buying interest will be strong enough to push prices higher. At resistance, traders expect selling pressure to cap price increases.
Identifying these levels helps you determine your entry and exit points, manage risk effectively, and prepare for potential market movements.
Identifying Support and Resistance
How exactly do you spot these invisible barriers?
* Historical Price Levels: Review historical charts using tools like TradingView. Look for repeated price stalls or reverses. History repeats itself, huh?
* Trend Lines: Drawing trend lines along peaks (resistance) or troughs (support) helps visually identify these levels.
* Moving Averages: Popular moving averages, such as the 50-day and 200-day, act as dynamic support or resistance.
* Psychological Levels: Round numbers (e.g., \$100,000 for Bitcoin, 1.2000 in Forex pairs) often form psychological barriers, as traders naturally place orders around intuitive price points.
* Fibonacci Retracements: Fibonacci levels (23.6%, 38.2%, 50%, 61.8%, and 78.6%) are used by many traders to identify potential support and resistance zones.
Practical Application: Using Support and Resistance
Knowing these concepts is one thing—putting them to practical use is another. Before jumping to your trading account, you should practice a lot to master the following concepts:
1. Entry and Exit Points: Buy near support, expecting the price to bounce upwards, and sell near resistance, anticipating a downward reversal.
2. Stop Loss and Risk Management: Set stop-loss orders slightly below support (when buying) or slightly above resistance (when selling) to minimize potential losses.
3. Breakout Trading: Look for instances when prices decisively break through support or resistance levels. Such breakouts often signal strong moves and excellent trading opportunities.
Advanced Techniques: Trading Breakouts
Breakouts occur when price movement surpasses support or resistance, signaling a potential continuation of the trend. Traders often wait for confirmation of a breakout through high volume or multiple candle closes beyond the support or resistance level.
Volume Confirmation: High volume during a breakout suggests a valid move, while low volume could indicate a false breakout.
Retests: Prices frequently retest broken support or resistance levels. A retest confirms the reliability of the breakout, giving traders added confidence.
Beware of False Signals, or You’ll Get Rekt
Support and resistance levels, while invaluable, aren’t foolproof. Markets occasionally give false signals, known as “false breakouts,” where prices briefly move through these levels only to revert quickly. You must lower your risk by awaiting confirmation (such as a sustained close above resistance or below support) before committing to trades.
The Power of Confluence
The strongest support and resistance levels are confirmed by multiple indicators, termed “confluence.” For instance, if historical resistance aligns with a major moving average, Fibonacci retracement, and a psychological level, this creates a highly reliable resistance zone.
Integrating Support and Resistance with Other Technical Tools
If you want to become a solid, profitable trader, you can build your trading strategy on the shoulders of support and resistance. Combining these two concepts with other technical analysis tools can help you achieve profitability. Here are some tools you can use to succeed.
Oscillators (RSI): Identify overbought or oversold conditions near support/resistance.
Candlestick Patterns: Engulfing candles, hammers, or shooting stars at support or resistance levels reinforce potential reversal points.
Chart Patterns: Recognizable patterns, such as head-and-shoulders, double tops and bottoms, and triangles, often correspond with clear support and resistance levels.
Pro tip: Utilize UltraTrader’s online trading journal to assess the performance of your strategy. Refining a strategy is much more profitable than not having a clue when and why you are entering a trade.
Final Thoughts
Support and resistance are foundational concepts of technical analysis. Learning these two concepts is like learning the basic language of the chart.
Remember, while these concepts will provide you with some solid insight into the market, they aren’t a silver bullet. Successful traders combine multiple methods and continuously refine their strategies.