


Forex
Gold (XAU/USD)
Price Movement:
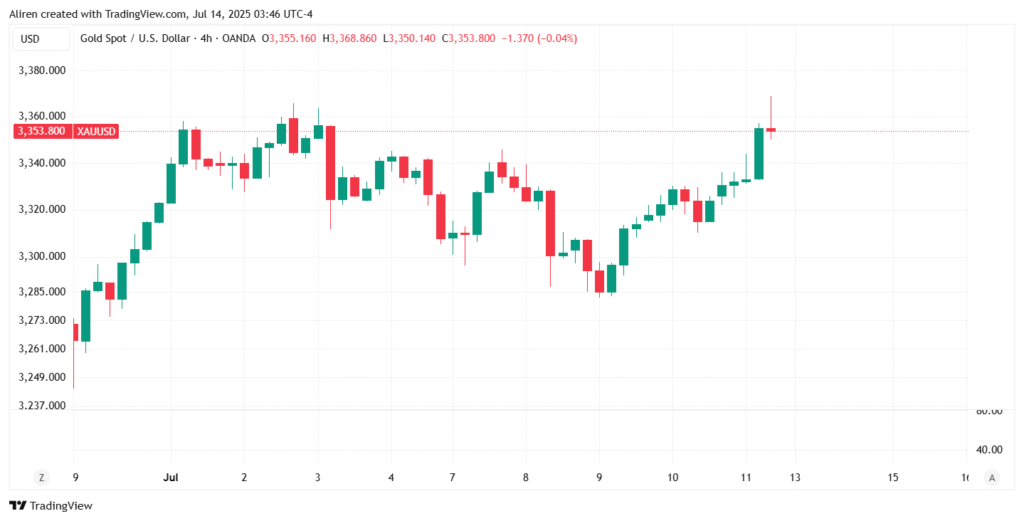
Gold prices increased nearly 1% on Friday due to growing concerns about trade policies from US President Donald Trump. He imposed tariffs on Canadian goods and is considering extending them to other countries and copper. At that time, the price of gold (XAU/USD) was $3,354, up from a low of $3,322.
Influencing Factors:
On Thursday, Trump announced a 35% tariff on Canadian goods but said some products would be exempt if they follow the USMCA trade deal from 2020. He also mentioned plans to impose 15% to 20% tariffs on most trading partners.
In the US, the economic calendar is light. Chicago’s Fed President Austan Goolsbee expressed confusion over calls to cut interest rates to lower government debt. He emphasized that the Fed’s primary goals are jobs and price stability.
Technical Insights:
The price of gold is on the rise again, reaching above $3,350. This increase suggests that it could go even higher. The Relative Strength Index (RSI) has become positive lately, showing that more buyers are entering the market.
If XAU/USD closes above $3,350, it could aim for the $3,400 level. If it breaks through that, the next target will be $3,450, which is close to the record high of $3,500. On the other hand, if gold prices drop to $3,300, we can expect lower prices ahead. The following support levels to watch are the 100-day Simple Moving Average (SMA) and the June 30 price of $3,246, followed by $3,200.
US Dollar Index (DXY)
The US Dollar continues to exhibit strength as markets react to the latest developments in trade policy. Following last week’s renewed tariff threats from US President Donald Trump, global trade tensions remain elevated, fostering a risk-averse environment among investors. This cautious sentiment continues to bolster the Greenback’s reputation as a haven.
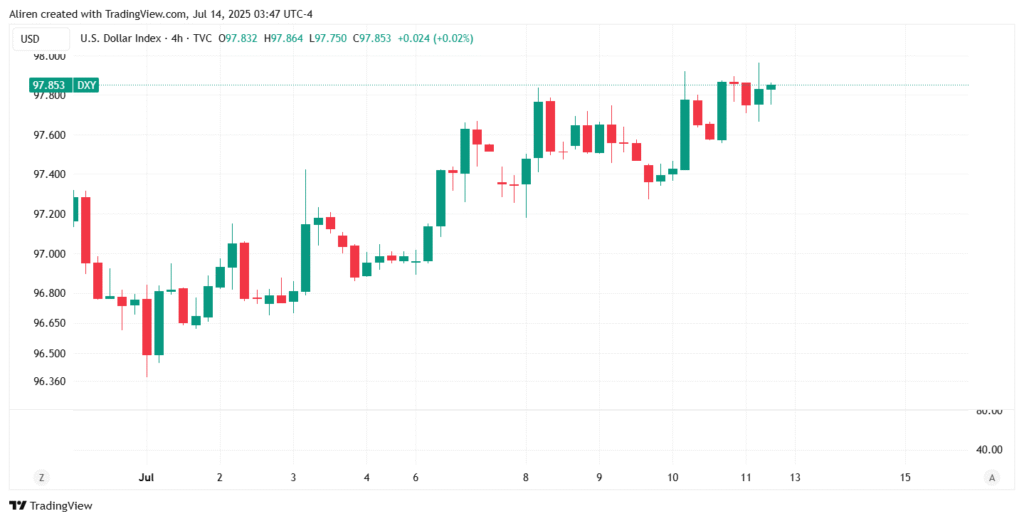
The US Dollar Index (DXY), which measures the Greenback’s performance against a basket of major currencies, has been showing a steady performance, trading around 97.89. Despite a modest dip from last week’s close, the index is still maintaining gains, reflecting overall market sentiment amidst ongoing geopolitical uncertainties. The index has registered a weekly gain of over 0.8%, although it struggles to breach significant technical resistance levels between 97.80 and 98.00.
Investors remain wary of potential retaliatory measures from trading partners following Trump’s aggressive tariff stance. The administration’s recent warnings to over 20 countries, including Canada, Japan, and South Korea, have stoked fears of escalating trade conflicts, which could lead to increased import costs and inflation. Trump’s announcement of a 35% tariff on Canadian imports, effective August 1, underscores the administration’s commitment to a tougher trade policy. The letter to Canadian Prime Minister Mark Carney cited concerns over fentanyl trafficking and long-standing trade imbalances as reasons for this decision.
Additionally, the President’s indication that other trading partners, especially those in the European Union, are next in line for tariff notifications keeps uncertainty alive in the markets. Economists continue to advise caution, as such sweeping measures could make global trade negotiations increasingly complex.
Technical Insights:
Technically, the US Dollar Index is hovering around key support levels, with significant attention on upcoming US inflation data and commentary from the Federal Reserve for further direction. As traders await these developments, consolidation is the prevailing trend in the market.
Fed’s Goolsbee warns that new tariff threats could hamper rate cut hopes.
In an interview with the Wall Street Journal, Austan Goolsbee, the President of the Federal Reserve Bank of Chicago, warned that Trump’s ongoing trade policies and constant tariff threats could make it harder for the Federal Reserve to cut interest rates. Both the broader market and Donald Trump himself want to see these rate cuts.
In the past few months, concerns about how tariffs might raise prices decreased after Trump paused the high tariffs he suggested in April. This allowed the Federal Reserve to consider lowering interest rates soon.
However, the new round of tariffs could raise worries about inflation again. This might lead the Fed to keep its current strategy of waiting for more information before making changes.
Crypto
Bitcoin may grow more after reaching a new all-time high.
Price Movement:
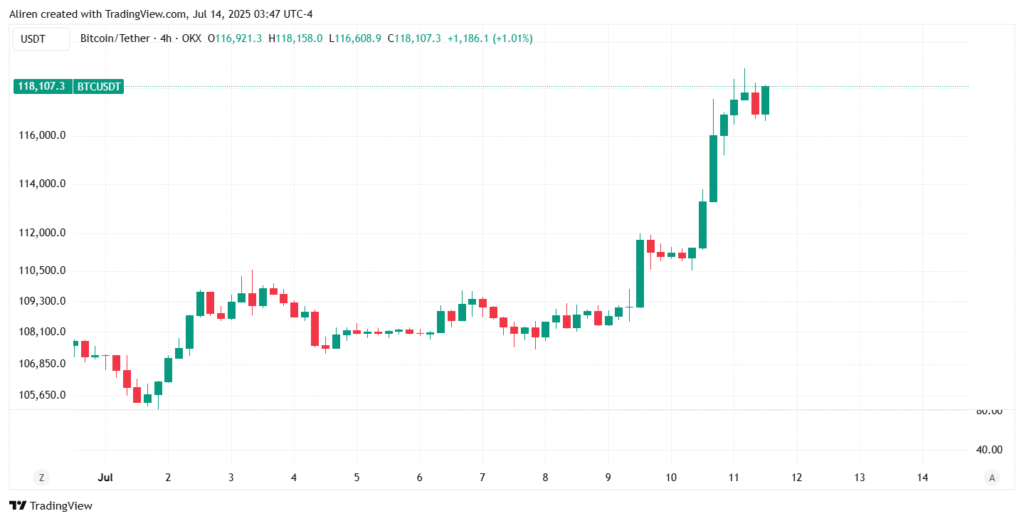
Bitcoin (BTC) smashed the $118,000 mark for the first time in its history on Friday. Despite the rally, Bitcoin has seen little indications of Fear of Missing Out (FOMO) activity among traders in the past two days, signaling that the top crypto asset has more price growth potential in the current market cycle.
Influencing Factors:
BTC’s rally was fueled by substantial institutional accumulation, with $1.18 billion net inflows into US spot BTC ETFs during the week. On-chain metrics like the Long-Term Holder (LTH) Net Unrealized Profit and Loss (NUPL) metric remained below the euphoria zone, suggesting further upside potential. Short-term holders (STHs) also showed reluctance to take profits, reflecting a market with controlled sentiment rather than excessive speculation. Funding rates remained neutral, signaling low FOMO-driven activity.
Technical Insights:
With Bitcoin’s current rally, short-term holders (STHs) usually lock in some of their unrealized profits. However, many are choosing to hold on to their Bitcoin, similar to long-term holders (LTHs). Analyst CryptoMe pointed out that the market does not show signs of overheating or excessive selling from short-term holders who are making a profit.
Analysts from CryptoQuant also noted a significant increase in Bitcoin open interest, which rose to $81.4 billion last Friday after Bitcoin’s price went above its previous peak of $112,000. Despite this increase, funding rates have stayed close to neutral, indicating that traders are not feeling an intense fear of missing out (FOMO).
“This means investors are not aggressively opening long positions using high leverage driven by FOMO,” the report says.
Ethereum (ETH)
Price Movement:
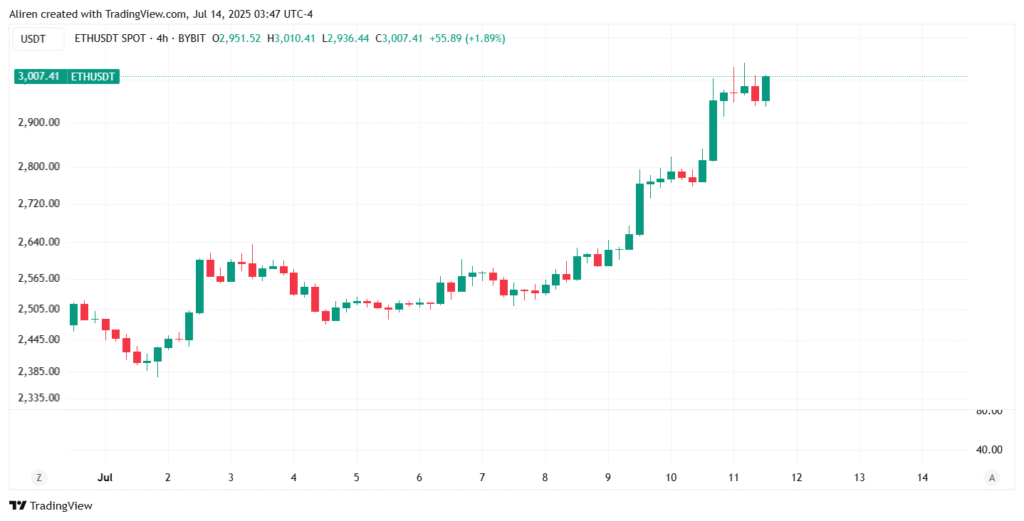
Ethereum (ETH) briefly went above $3,000 on Friday. This rise was driven by strong buying from institutional investors through ETH exchange-traded funds (ETFs) and Nasdaq-listed SharpLink Gaming (SBET).
Influencing Factors:
SharpLink Gaming, a firm that focuses on Ethereum and esports marketing, announced that it bought 10,000 ETH for $25.72 million from the Ethereum Foundation in a private deal that closed on Thursday. The purchase price was $2,572 per ETH. This increased the company’s total ETH holdings to 215,957, which is worth over $600 million based on current prices, according to the Strategic ETH Reserve website.
SharpLink went all-in on its ETH treasury strategy in June after launching a $425 million private placement spearheaded by Consensys. Since then, four other companies, including BitMine (BMNR), Bit Digital (BTBT), BTCS, and GameSquare, have launched ETH treasuries.
SharpLink’s shares closed on Friday with a 17% gain, extending its weekly gains to 71%.
The development comes at a time when ETH is also seeing strong demand on the institutional front.
Technical Insights:
Ethereum experienced $256.49 million in futures liquidations on Friday, with long and short liquidations at $62.36 million and $194.13 million, respectively. After surpassing key resistance at $2,850, ETH briefly reclaimed the $3,000 level but now faces resistance near the upper boundary of an ascending broadening wedge. If it converts this resistance to support, ETH could rally another 17% towards $3,470, though a hurdle at $3,220 may arise. The Relative Strength Index (RSI) and Stochastic Oscillator (Stoch) indicate strong bullish momentum but suggest a potential short-term pullback.
XRP
Price Movement:
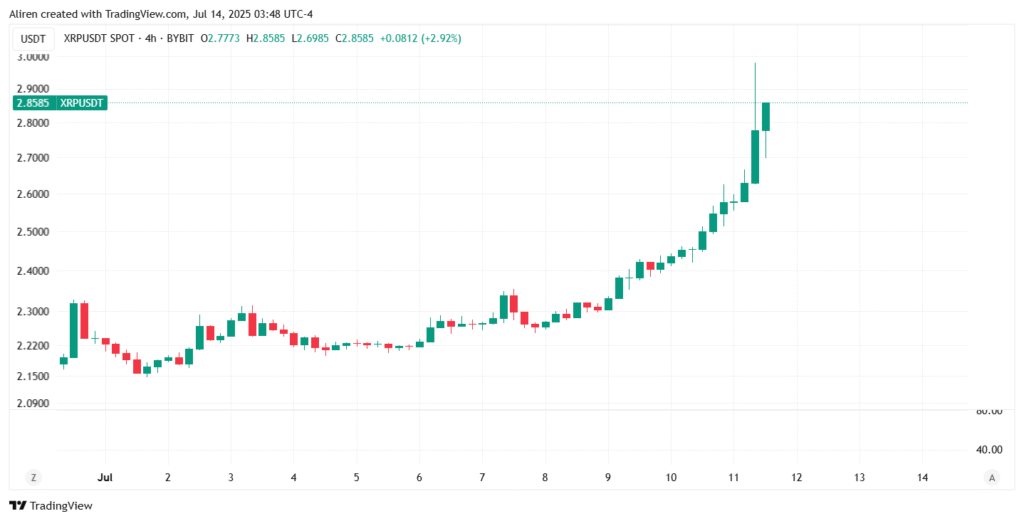
Ripple (XRP) is continuing to recover, now trading above $2.80. This trend is seen across major cryptocurrencies, suggesting a strong potential for XRP to rise above the critical resistance level of $3.00.
However, on-chain data indicates that the upward trend might be losing strength. Some investors are taking profits or moving XRP to exchanges to sell. Understanding metrics like Exchange Balance and Total Supply in Profit can provide a clearer picture of XRP’s direction, especially now that investors are becoming more willing to take risks.
Technical Insights:
XRP has sustained the uptrend since the drop to the June low of $1.90, accruing nearly 50% in gains.
The steady price increase can be attributed to growing risk-on sentiment and a stronger derivatives market, as evidenced by the futures Open Interest’s (OI) recovery to $5.9 billion, up from $3.5 billion on June 23.
Conclusion: Investor Considerations
The week ending July 6, 2025, witnessed a mix of cautious optimism and geopolitical headwinds. Gold and cryptocurrencies benefited from safe-haven demand, while equities faced pressure from trade policies. Upcoming US CPI data and Federal Reserve commentary will likely shape market sentiment. As always, this report is informational and not financial advice.