


Gold is poised to end the week with profits ahead of FOMC minutes.
- Gold set to end the week up 0.80% despite Friday’s drop.
- US Retail Sales plunge, fueling US Dollar weakness and lower Treasury yields.
- Investors price in over one Fed rate cut, boosting bullion’s longer-term appeal.
Gold prices dropped below $2,900 on Friday but are set to finish the week with over 0.80% gains as traders take profits.
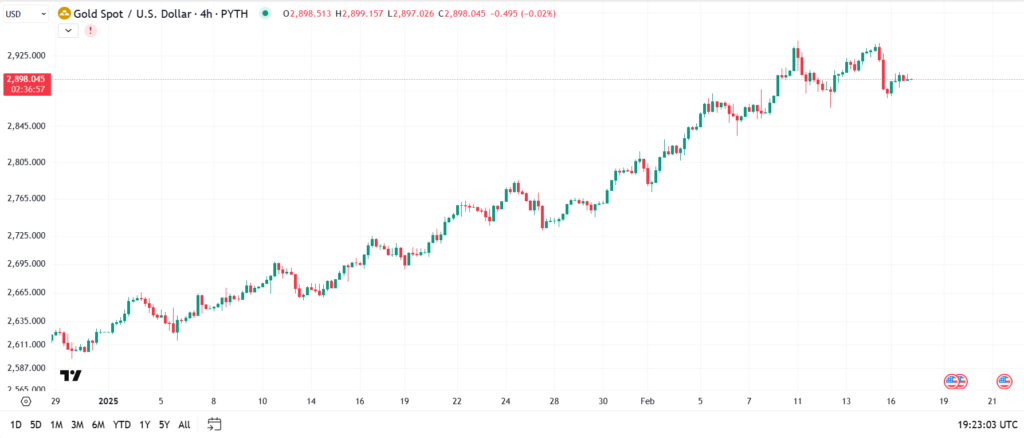
US economic data was mixed, with the dollar hitting yearly lows and Treasury yields falling. XAU/USD trades at $2,883, down 1.48% daily.
US retail sales fell sharply by -0.9% in January, worse than the expected -0.1%. Meanwhile, industrial production grew by 0.5%, exceeding forecasts. The weaker dollar helped support gold prices.
Central banks purchased over 1,000 tons of gold for the third straight year in 2024, with significant increases following Trump’s electoral victory.
The technical outlook for XAU/USD: The gold price is pulling back after an all-time high, hitting a two-day low of $2,878. The first key support is the $2,850 mark. If that holds, the next resistance is at $2,900. A break above this would target $2,942, then $2,950, and $3,000.
US Dollar set for a weekly loss over 1.5% in horror January Retail Sales result.
- The US dollar dives lower after US retail sales and is set to close the week at a loss.
- Almost a full -1 % slide in headline Retail Sales for January spells domestic issues for President Trump.
- The US Dollar Index (DXY) drops substantially below 107.00 and is returning to 106.50.
The US Dollar Index (DXY), which measures the value of the US Dollar (USD) against six major currencies, is falling significantly towards 106.50. Since Monday, it has lost over 1.5% in value. President Donald Trump faces challenges at home, alongside the ongoing egg crisis, as US Retail Sales show concerning trends.
January saw a sharp decline of -0.9% in overall sales, and sales excluding cars and transportation also dropped by -0.4%. This indicates that American consumers are saving their money for uncertain times.
Investors will focus on the S&P Global Purchase Managers Index (PMI) preliminary data for February, which will be released on Friday, February 21. The weekend may bring more news if President Trump makes announcements about tariffs, Ukraine, or other issues.
Daily digest market movers: Retail sales look bleak
Here are the key data updates for this Friday:
The January Import/Export report shows the Export Price Index rose 1.3%, higher than the expected 0.3%. The Import Price Index came in at 0.3%, below the forecast of 0.4% but up from a revised 0.2% in December.
January Retail Sales decreased by 0.9%, much worse than the expected 0.1% drop. This is a significant decline from December’s revised growth of 0.7%. Retail Sales, excluding Cars and Transportation, fell by 0.4%, missing the expected growth of 0.3% and down from the revised 0.7% growth last month.
Equity markets are struggling, with European and US indices showing losses before the US market opens.
The CME FedWatch tool indicates a 57.4% chance that interest rates will remain unchanged in June. This suggests the Fed may keep rates steady longer to tackle ongoing inflation.
The US 10-year yield is around 4.47%, dropping significantly from this week’s high of 4.657%.
US Dollar Index Technical Analysis: Next leg lower
The US Dollar Index (DXY) finished the week with an apparent loss. It is now at the strong resistance level of 107.35. The DXY depends on moving averages and the Relative Strength Index (RSI), which still has room to drop further. Keep an eye on the 200-day Simple Moving Average (SMA) around 104.93, which could be significant.
On the upside, the previous support at 107.35 has become strong resistance. To move higher, the DXY needs to get back above 107.90, the 55-day SMA, before reaching 108.00.
On the downside, watch for support levels at 106.52 (the April 16, 2024, high), 106.34 (the 100-day SMA), or even 105.89 (resistance from June 2024). Although the RSI suggests more downside, the 200-day SMA at 104.93 could be a target.
Trump’s US reciprocal tariffs pause fails to improve the outlook of the Bitcoin and crypto market.
President Donald Trump signed a memo to delay the start of reciprocal tariffs, initially set for this week. This pause allowed Bitcoin and other top cryptocurrencies to halt declines, reflecting a growing link between the crypto market and macroeconomic factors. With the tariffs now scheduled for April, investor sentiment in Q2 may be negatively impacted.
Bitcoin and crypto markets recover briefly as Trump pauses US reciprocal tariffs.
On Thursday, President Donald Trump signed a memo directing his administration to create “reciprocal tariffs” for each foreign trading partner. This means the US will charge the same tariffs that other countries impose on American goods.
The order gives Secretary of Commerce Howard Lutnick and other officials the task of planning these tariffs for countries that tax US imports. Trump stated, “I have decided for fairness that I will charge a reciprocal tariff, meaning whatever countries charge the United States of America, we will charge them.”
These tariffs were expected to start this week after Trump mentioned them last week. However, during the signing in the Oval Office, Lutnick said the tariffs will likely begin in April.
The pause in the tariff plans relieved Bitcoin and the cryptocurrency market. As the market braced for the tariffs, Bitcoin dropped from over $98,000 to $95,000. With the delay, Bitcoin recovered to the $96,000 level.
Despite this, with the tariffs expected to start in the second quarter, investors may hesitate to invest in the crypto market. This is clear from the flows of Bitcoin ETFs, which have seen losses daily this week, totaling nearly $680 million in net outflows. This suggests that broader economic factors increasingly influence Bitcoin and the crypto market.
In recent weeks, the crypto market has faced negative macroeconomic trends, including a crash that erased over $2 billion from the crypto derivatives market between February 2 and 3. With ongoing economic uncertainty, Bitcoin and the crypto market will likely remain steady in the coming weeks unless something significant changes investor sentiment.
Top 3 Price Prediction Bitcoin, Ethereum, Ripple: BTC consolidates while ETH and XRP show some strength
- Bitcoin price consolidated between $94,000 and $100,000 for the last nine days.
- Ethereum price trades around $2,690 on Friday after rising almost 3% this week.
- Ripple price hovers around $2.55 after gaining nearly 7% this week.
Bitcoin (BTC) has consolidated between $94,000 and $100,000 in the last nine days. Ethereum (ETH) and Ripple (XRP) prices have been relatively stronger and gained nearly 3% and 7% this week, respectively.
Bitcoin prices consolidate between $94,000 and $100,000.
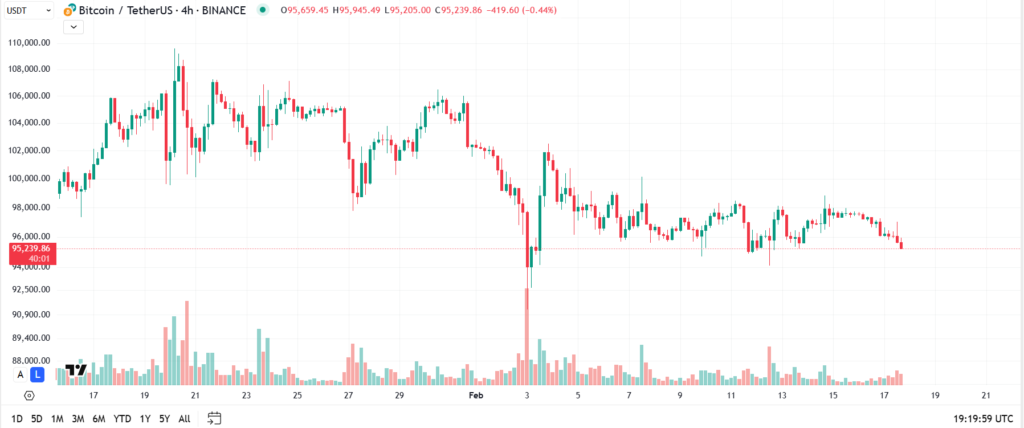
Bitcoin’s price broke below the $100,000 support level on February 4 and has been consolidating between $94,000 and $100,000. At the time of writing on Sunday, BTC is hovering around $95,500.
If BTC breaks above the upper consolidating range of $100,000, it would extend the recovery to retest its January 31 high of $106,012.
However, the Relative Strength Index (RSI) on the daily chart reads 44 after being rejected from its neutral level of 50 last week, indicating bearish momentum. Moreover, the Moving Average Convergence Divergence (MACD) showed a bearish crossover, hinting at further correction.
However, if BTC breaks and closes below the lower consolidating range of $94,000, it could extend the decline to test its psychologically important level of $90,000.
Ethereum price shows mild signs of strength.
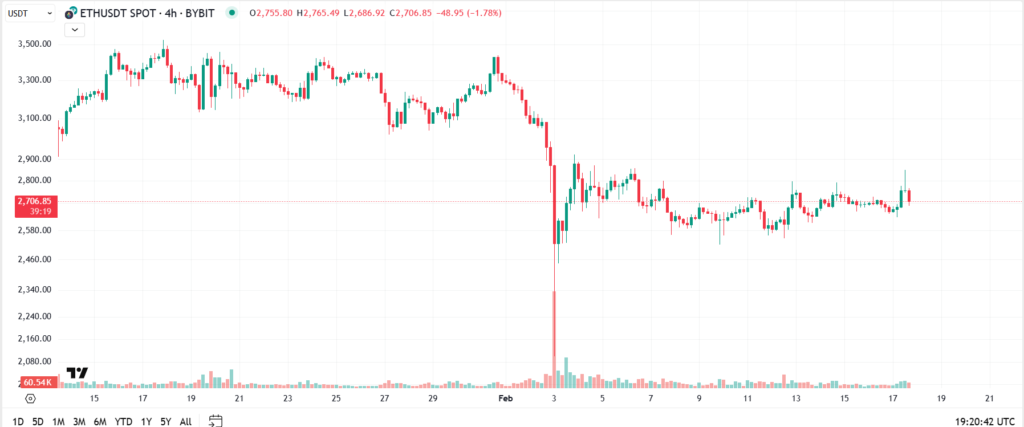
Ethereum’s price faced a rejection around its descending trendline on February 1 and declined 13.87%, closing below its psychologically important $3,000 level the next day. ETH continued its correction by nearly 9% in the previous week. However, ETH prices strengthened this week and recovered by almost 3%. At the time of writing on Friday, it hovers around $2,690.
If ETH continues to recover, it could extend the recovery to test the $3,000 level.
The RSI on the daily chart reads 38, bounced off from its oversold level of 30, indicating fewer signs of selling pressure. However, the RSI must trade above its neutral level of 50 to sustain the bullish momentum. Such a development would add a tailwind to the recovery rally.
However, If ETH continues its decline and closes below $2,359, it will extend the decline to test its next weekly support at $1,905.
Ripple bulls are aiming for the $2.72 mark
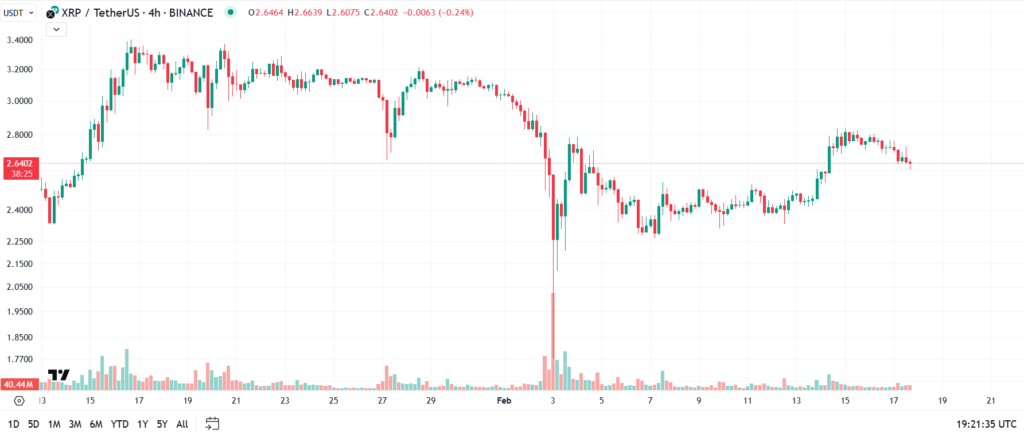
On February 2, Ripple’s price dropped below its rising trendline, falling by 10.35% and closing under its daily support level at $2.72. Last week, XRP faced challenges around the $2.72 mark and fell by 11.38% by Sunday’s close. However, XRP prices improved by nearly 7% this week, now around $2.55.
If XRP recovers, it could reach its daily resistance level of $2.72. The Relative Strength Index (RSI) on the daily chart shows a reading of 46. It bounced back from its oversold level of 30, suggesting a slight increase in buying interest. Like Ethereum, XRP needs its RSI to stay above 50 to maintain this positive momentum, supporting recovery.
However, if XRP continues to decline and falls below its daily support at $1.96, it could decrease further to test its weekly support level at $1.40.
Conclusion
This week, gold and cryptocurrency markets saw important changes due to economic news and policies. Gold kept its weekly gains despite a drop on Friday, thanks to weaker retail sales and a falling US dollar. Bitcoin stalled, but Ethereum and Ripple did better. A delay in Trump’s tariffs offered some relief, but economic uncertainty still affects how investors feel.
Next week, investors will focus on important economic indicators, such as the S&P Global PMI data, which could influence market trends. Traders should stay alert for potential volatility in gold, crypto, and foreign exchange markets.
With UltraTrader, trade smarter, not harder.