
Trading Journal vs Spreadsheets: What Excel Can’t Track

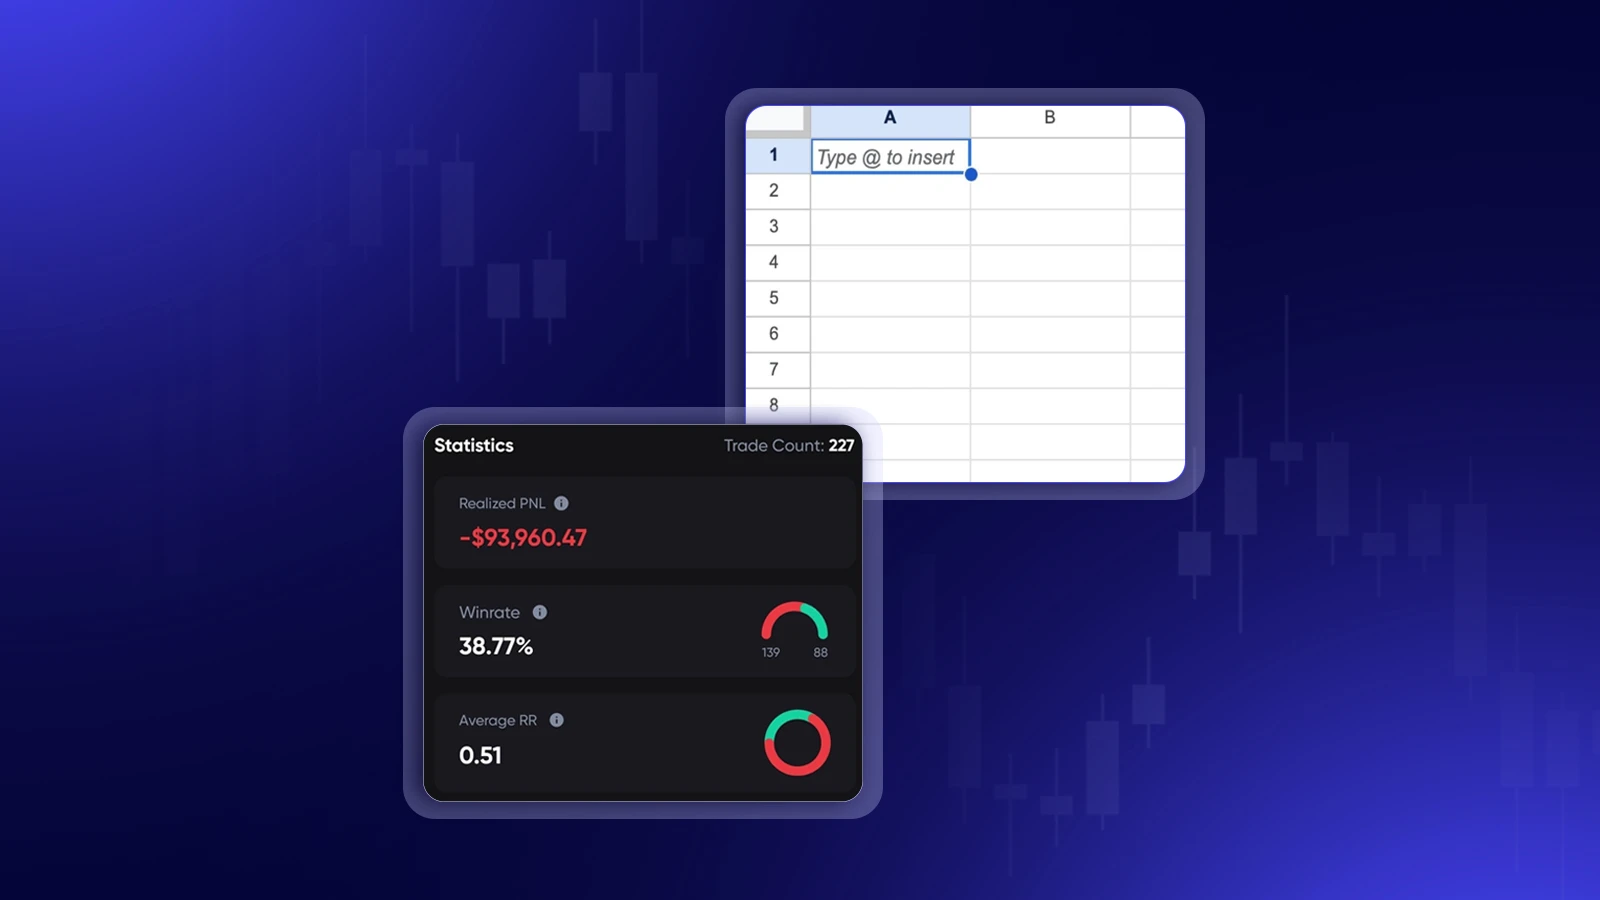
A spreadsheet is a fine place to start a trading journal. It stops being enough the moment you want to know why you lose.
Here’s the number that exposes the gap. The average trader banks 48 pips when the direction goes their way and gives back 83 when it doesn’t. Same trader, same market, and a 35-pip hole dug on exit timing alone. A basic Excel or Google Sheets journal records both of those as a win and a loss and moves on. It won’t show you the 83-versus-48 pattern underneath them, because the thing that reveals it never makes it into a cell.
So the honest answer to trading journal vs spreadsheet: if you place a few trades a month and you want a running ledger, a sheet does the job. If you’re trying to find and fix an edge, a spreadsheet has six specific blind spots, and each one hides a number that decides whether you make money.
What a spreadsheet actually does well
Start with what Excel gets right, because it’s more than most journal apps will admit.
A spreadsheet is free, and it’s yours. No subscription, no account, no company that can deprecate a feature you built your process around. It works offline, which matters when your connection drops mid-session. You can write any formula you can think of, build a pivot table on a slow Sunday, and slice the data however your strategy needs it.
There’s a quieter benefit too. Manual entry makes you handle every trade. Typing in your exit, your size, and your reason for the trade is a small act of review that a lot of automated tools skip right past. Plenty of profitable traders started on a Google Sheet and learned their own numbers by building the columns themselves.
A decent template already tracks the basics: date, instrument, direction, entry, exit, position size, P/L, R:R, win rate, and a column or two for tags. If you want that starting point without building it from scratch, UltraTrader publishes a free Excel and Google Sheets trading journal template that’s a reasonable place to begin.
For a low-volume ledger, a spreadsheet isn’t a downgrade. It’s the right tool. The wall shows up later.
Where the spreadsheet stops
Six things a purpose-built trading journal tracks that a spreadsheet can’t, and what each blind spot costs.
Auto-importing and de-duping your fills
Every trade in a spreadsheet is a trade you typed in. Miss a session, and the record has a hole you’ll never notice. The harder problem is partial fills. A single position often executes across four or five fills at different prices. In a sheet you either log it as one blended row and lose the detail, or type five rows and reconcile them by hand. Most traders do neither and skip it.
A journal built for this pulls fills straight from the broker or exchange, stitches the partials back into one position, and drops the duplicates. UltraTrader auto-syncs from platforms like Binance, Bybit, and MT4/MT5, so the log fills itself. The data-entry tax drops to zero, and the trades you’d have skipped at 1am are in the record. That’s the whole idea behind an automated trading journal: the trades you never got around to logging are usually the ones you least wanted to look at.

MAE and MFE per trade
This is the one that matters most, and it’s the one a spreadsheet structurally can’t do.
A sheet stores two prices: where you got in, and where you got out. It knows nothing about the path in between. It can’t tell you the trade ran 60 pips in your favor before you closed it at 20, or that it sat 40 pips underwater before it worked out. That path is MAE and MFE. Maximum Adverse Excursion is how far a trade moved against you before it turned. Maximum Favorable Excursion is how far it moved your way before you took profit.
Those two numbers are how you prove you’re cutting winners short. That 48-versus-83 gap from the opening lives here: MFE is the number that exposes it. When your average MFE is 60 pips and your average realized win is 25, you have hard evidence that your exits are the leak. A spreadsheet can’t capture MFE because it never sees the path, so the most common failure mode in retail trading stays invisible in the exact tool you built to catch it.
Session and time-of-day performance
A spreadsheet can hold a timestamp. It won’t tell you that you lose money almost every day between 3 and 4pm.
To see that, you need every fill tagged with an accurate execution time, grouped by hour and session, and weighted by P/L. You can build that pivot in Excel. You’ll rebuild it every week, and it’s only as good as the timestamps you typed, which in a manual journal means rounded, guessed, or missing. A trading journal timestamps every fill on import and keeps the session breakdown as a standing view. That’s how you find the worst hour you keep trading anyway.
Tag-based edge analysis
Tagging works fine in a sheet until you ask a real question of it. Filter for setup equals breakout, and it holds. Filter for breakout AND London session AND held longer than an hour AND tagged “planned” rather than “revenge”, and the sheet turns into a pile of helper columns and nested filters. That combined view is where edge actually hides. A journal built for it lets you stack tags and read profit factor per combination, so you can find the one setup carrying your account and the three quietly bleeding it.
Sync across iOS, Android and web
Your spreadsheet lives where you left it. If it’s on your laptop, it isn’t with you at your desk when you’re staring at your phone deciding whether to re-enter. Cloud sheets help, and now you’re fighting a mobile spreadsheet UI at the exact moment you need to log a trade fast. A journal app carries the same data on every device, so logging happens where the trading happens, not an hour later from memory.
Screenshot and chart attachment
A trade is easier to review with the chart sitting next to it. In a spreadsheet a screenshot is an awkward floating object pinned near a row, or a link to a file somewhere else that you’ll lose. A journal attaches the chart to the trade itself, so when you review the setup three weeks later the picture is right there with the numbers. Small thing. It’s the difference between reviewing your trades and meaning to.
Spreadsheet vs trading journal, side by side
| Capability | Spreadsheet (Excel/Sheets) | Purpose-built trading journal |
|---|---|---|
| Logging a trade | Type in every trade by hand | Auto-imports from broker or exchange |
| Partial fills | Blended by hand or skipped | Stitched into one position and de-duped |
| MAE / MFE (the trade’s path) | Not possible, only entry and exit are stored | Tracked per trade |
| Session / time-of-day view | Build the pivot yourself, every week | Standing view, auto-timestamped |
| Multi-tag edge analysis | Breaks down past 2-3 filters | Stack tags, profit factor per combination |
| Chart screenshot on the trade | Awkward floating object | Attached to the trade |
| Devices | Wherever the file happens to be | iOS, Android, and web, synced |
| Works offline | Yes | Partial, entries sync when you reconnect |
| Cost | Free | Free plan for manual tracking and analytics; auto-import on Premium |
| Lock-in | None, it’s your file | Export available, account required |
Two rows go to the spreadsheet on purpose. It’s free, and it’s better offline. That’s the fair read. The other eight are where a journal does something a sheet can’t, and the next section is what those eight are worth in P/L.
What the blind spot costs: 5,000 accounts
None of this is theoretical. UltraTrader ran the numbers on 5,000 anonymized accounts over a trailing 12 months, split into traders who logged, tagged, or annotated at least 75% of their trades within 24 hours of the close, and traders who fell below that line.
| Metric | Active journalers | Non-journalers |
|---|---|---|
| Win rate | 44.5% | 53.2% |
| Risk-to-reward | 1:2.15 | 1:0.85 |
| Profit factor | 1.42 | 0.91 |
| Max drawdown | 4.1% | 8.9% |
| Expectancy (per $ risked) | +$0.40 | −$0.10 |
Read the top row first, because it’s the trap. The journalers won less often. 44.5% against 53.2%. If win rate were the scoreboard, the non-journalers would be ahead by nine points.
They’re behind. Their profit factor is 0.91, which means for every $100 they pull from winners they hand $110 back on losers. The journalers sit at 1.42: every $100 in winners costs about $70 in losses. The whole difference is R:R, 2.15 against 0.85. A basic spreadsheet doesn’t compute R:R for you, and MAE/MFE is the pair of numbers built to move it.
The expectancy line is the money. Positive 40 cents per dollar risked against negative 10. On 200 trades a year at $200 of risk each, that spread is the distance between making $16,000 and losing $4,000.
Here’s the part that ties back to the tool. Win rate is the one metric a spreadsheet hands you cleanly, and it’s the one closest to useless. R:R, drawdown path, expectancy, and per-setup profit factor are the numbers that predict whether you keep your account, and they’re the ones a manual sheet either can’t produce or produces a week too late to act on.
When a spreadsheet is still the right call
The point here isn’t that everyone should switch. Plenty of traders shouldn’t, at least not yet.
Trade five times a month, and a spreadsheet opens faster than any app. Trade one instrument and one setup, and the multi-tag analysis you’re missing is analysis you don’t need. Still learning what your own data looks like, and building the columns by hand teaches you more than an auto-filled dashboard will. If that’s you and you want a clean starting structure, the free Excel and Google Sheets template covers it without the busywork of building one.
The switch pays off when volume climbs, when you trade more than one market, or when you’ve got a nagging sense your exits are costing you and no way to prove it. That’s where the six blind spots stop being minor and start being the reason the account isn’t growing.
UltraTrader’s free plan covers manual trade logging and the full analytics set, so you can read your profit factor, expectancy, and session breakdown without paying. Auto-import from your broker, CSV upload, and chart attachments are on Premium, at $9 a month billed annually. The free tier is enough to answer the question this post opened with. Log a month of trades, compare your MFE against your realized wins, and see whether Excel was hiding something.
Frequently asked questions
Is a trading journal better than a spreadsheet? For finding and fixing an edge, yes. A spreadsheet stores only entry and exit prices, so it can’t track MAE/MFE, auto-import fills, or break performance down by session. For a simple low-volume ledger, a spreadsheet is enough. The switch pays off once you trade often enough that manual entry starts getting skipped, or once you need to see why your exits are costing you.
What can a trading journal track that Excel can’t? Six things a spreadsheet structurally can’t do: auto-import and de-dupe fills from your broker, MAE/MFE (how far each trade moved for and against you before you closed it), session and time-of-day performance from accurate timestamps, multi-tag edge analysis across several filters at once, sync across phone and desktop, and chart screenshots attached to each trade.
Can I use Excel or Google Sheets as a trading journal? Yes, and it’s a reasonable start. A spreadsheet costs nothing and works offline, and you can shape every column to your strategy. Manual entry also forces you to review every trade. It works well for low trade volume and a single strategy. The limits show up around exit analysis (MAE/MFE), automated import, and any view that needs to combine several tags or timestamps at once.
Is a trading journal free? UltraTrader has a free plan that covers manual trade logging and the full analytics set, including profit factor, expectancy, and session breakdowns. Auto-import from brokers and exchanges, CSV upload, and chart attachments are part of Premium, which is $9 per month billed annually.
Do I need to switch from my spreadsheet? Not necessarily. Stay on a spreadsheet if you trade rarely, trade a single instrument, or are still learning your own data by hand. Switch when volume rises, when you trade multiple markets, or when you suspect your exits are the leak and a sheet can’t prove it. In a 5,000-account study, traders who journaled consistently ran a 1.42 profit factor and 4.1% max drawdown against 0.91 and 8.9% for those who didn’t.