


Gold jumps above $4,200 before easing back on profit-taking
Gold had a strong and volatile week. The price started the period trading around the $4,100 region. Then it pushed sharply higher mid-week, briefly breaking above $4,200 as traders doubled down on expectations of a Federal Reserve rate cut in December.
The move was driven by a mix of softer U.S. data, lingering geopolitical risk, and ongoing concerns about government finances after the recent shutdown. Safe-haven demand picked up, and flows into gold remained solid as investors looked for protection against policy uncertainty and potential currency weakness.
Later in the week, some profit-taking kicked in and spot prices slipped back from the highs, but gold still finished the period comfortably above the $4,000 mark, keeping the broader uptrend intact.
Technical outlook
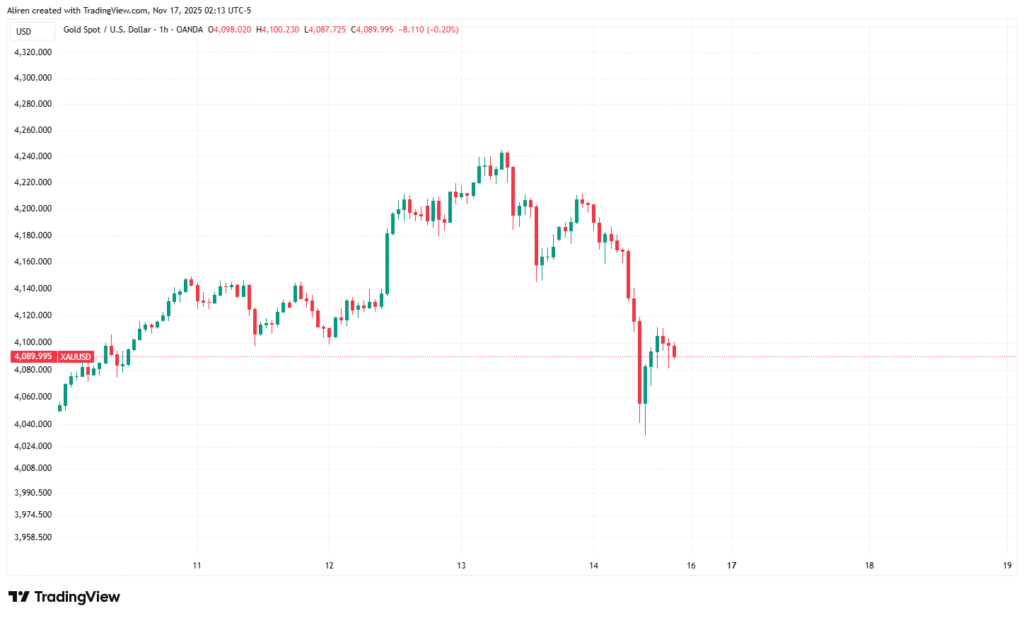
From a technical perspective, the area around $4,000 now acts as a key pivot. As long as buyers defend this zone, the bullish structure remains in place. Immediate support sits at $4,050–$4,000, followed by $3,950 if volatility increases.
On the upside, the $4,200 region is the first major resistance, with the recent record high slightly above that still on the radar. A daily close back above $4,200 would signal fresh breakout potential, while a drop below $4,000 would suggest a deeper correction toward medium-term moving averages.
U.S. Dollar Index holds just under 100 in a choppy week
The U.S. Dollar Index (DXY) traded in a relatively tight range this week. It opened around 99.6 on Monday and spent the following sessions drifting slightly lower before stabilizing again near 99.3 by the end of the period.
Mixed economic signals kept the dollar from making a decisive move in either direction. Softer inflation and ongoing uncertainty over the timing and scale of future rate cuts weighed on the greenback, while safe-haven demand and cautious risk sentiment prevented a deeper sell-off.
Technical analysis
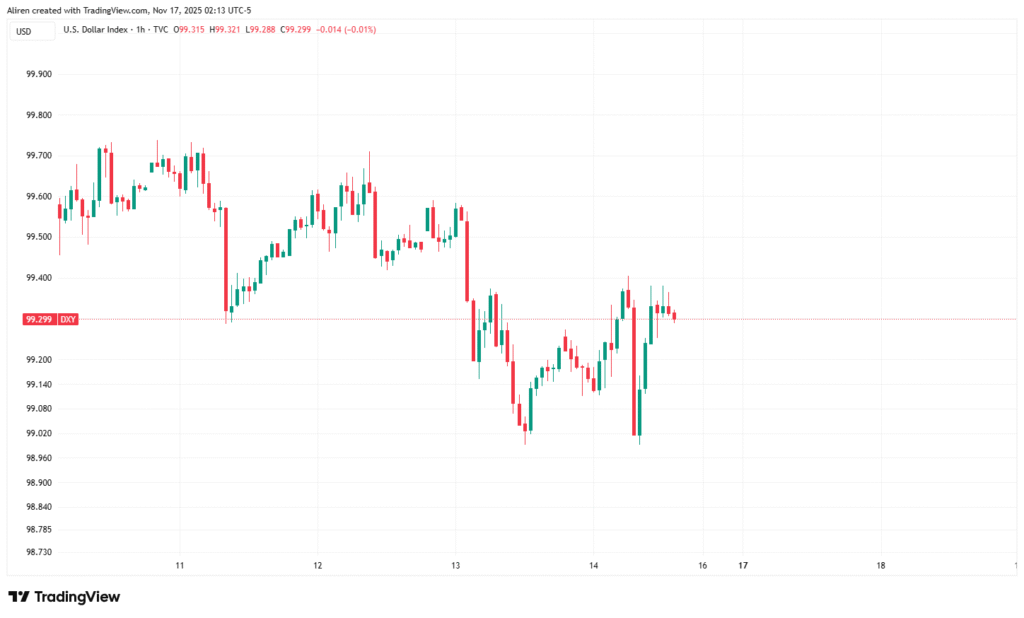
Technically, the dollar is still stuck just below the key psychological 100 level. Resistance remains in the 99.8–100.0 area, where rallies have repeatedly stalled. As long as DXY stays under 100, the short-term bias leans slightly bearish toward the 98.8–98.5 support zone.
A clean break and daily close above 100 would suggest that dollar bulls are regaining control and could open the door for a move back toward the early-Q4 highs. Conversely, a drop below 98.5 would confirm a deeper corrective phase.
Bitcoin slides from $106,000 toward the mid-$90,000s
Bitcoin had another tough week as the ongoing correction deepened. BTC started the period trading slightly above $106,000 on Monday but gradually lost ground over the next few sessions. By Friday and the weekend, price action was hovering in the mid-$90,000s, with intraday lows briefly testing below $95,000.
Several factors combined to pressure the market: long-term holders took profits after the October all-time high, leverage remained elevated in derivatives markets, and broader risk sentiment stayed fragile. As prices moved lower, a series of long liquidations accelerated the decline, pushing BTC to a new multi-month low before dip buyers slowly stepped in.
Technical outlook
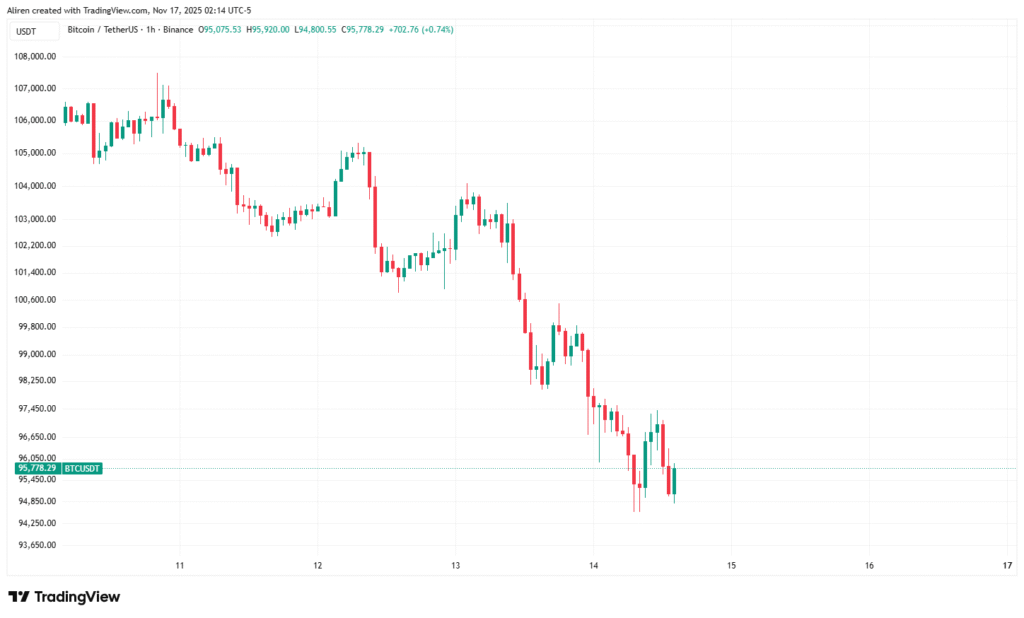
The short-term structure for Bitcoin remains fragile. Immediate resistance is now clustered around $100,000–$102,000, followed by a stronger barrier near $106,000, which was the starting area for this week’s move.
On the downside, the $95,000 zone is the first important support to watch. A clear break below that level would increase the risk of a deeper extension toward $92,000–$90,000. For bulls, the first sign of recovery would be a daily close back above $102,000, with confirmation coming only if BTC can reclaim and hold above the $106,000 region.
Ethereum falls from around $3,600 to close to $3,100
Ethereum closely tracked Bitcoin’s weakness but showed slightly higher percentage losses over the week. At the start of the period, ETH was trading around $3,600. Selling pressure then intensified mid-week, and by the end of the session on Sunday, the price had dropped toward the $3,100 area.
The move reflected a combination of de-leveraging in futures markets, profit-taking from larger holders after the recent rally, and a general risk-off tone across crypto. Open interest declined as traders reduced exposure, while spot buying only really appeared once ETH approached the low-$3,000s, where value-oriented participants started to step back in.
Technical outlook
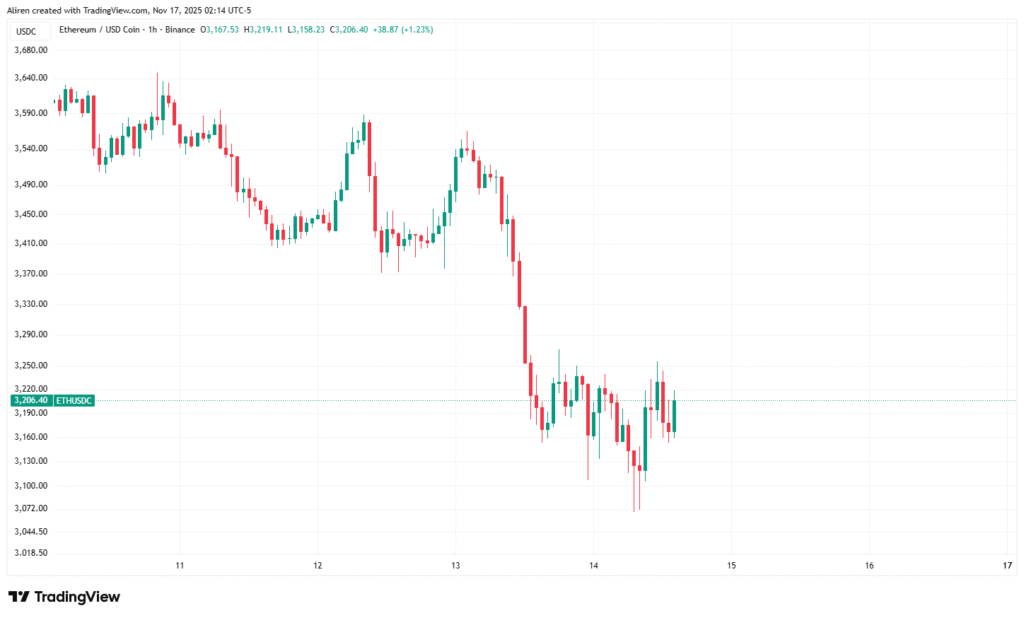
From a technical standpoint, Ethereum is now trading well below its recent highs and is trying to build a new support base. The $3,000–$3,100 area is the first key support zone; if this level fails, downside targets could shift toward $2,900–$2,800.
On the upside, initial resistance sits near $3,300, followed by a more significant barrier around $3,500–$3,600, where heavy supply is likely to emerge. ETH would need to break and hold above that higher band to signal that the broader uptrend is back in control rather than a simple corrective bounce.
Weekly Market Wrap-Up
Overall, the week delivered a familiar split between traditional and digital assets. Gold continued to benefit from rate-cut expectations and safe-haven flows, briefly breaking above $4,200 before easing back but still holding well above $4,000. The U.S. dollar spent the week moving sideways just below the 100 level, caught between softer data and ongoing demand for security.

Start Journaling Today

Start Journaling Today
In contrast, Bitcoin and Ethereum extended their corrective phases. BTC slid from above $106,000 to the mid-$90,000s, while ETH dropped from around $3,600 to close to $3,100 as liquidations and profit-taking weighed on prices.
Heading into next week, traders will be watching whether gold can defend the $4,000 zone, if DXY can finally break out above or below its tight range around 99–100, and whether crypto can establish a solid floor or faces another leg lower in this correction.